This is another one in the problem solving series. And it’s a little involved.
It consists of three different problems but all related. The first two are just straight-forward math problems. The third one is an application of that to COVID-19 Nepal data.
Money in The Bank
By twelfth grade, many school children in Nepal will have been taught some basic financial calculations — figuring out the balance on a fixed deposit given the principle, interest rate, and duration in years. So this question is about that.
Assume you place Rs. 50K in a fixed deposit at your bank. You accrue an annual compound interest of 7% on it. The following are some questions about that.
- What will the balance be at the end of the first year?
- What will the balance be at the end of 10 years.
- If you place your money in a fixed deposit for an indefinite period of time, how many years does it take for your money to double? (That is what’s the doubling rate?)
- After placing your money in a fixed deposit for an indefinite amount of time, you discover that the balance stands at Rs.139K. How many years has it been since the deposit?
- By analyzing the pattern in the numbers you used in the above problems and/or with the help of additional analysis DERIVE a mathematical formula for problems of this nature — numbers or values that are characterized by uniform rate of change, i.e. those that change at a constant rate.
Money in the Car
Money placed in fixed deposits accrue interest and the balance goes up in time. Conversely, consumer goods such as smartphones, computers, vehicles etc. devalue over time. Unlike in Nepal, in most countries, the value of a brand new car devalues over time — in maney countries, quite dramatically too.
Let’s say you bought a car valued at Rs. 5 million. Let’s also assume that it devalues at a constant yearly rate of 5%. How many years will it be before your car is worth just half as much as it cost you?
It’s been eight years since your sister bought her car. But because of the kind of car it is, it devalues at 14% per annum, and it’s now worth only Rs. 50K. How much had she paid for it?
Betting on COVID-19
Over the course of the pandemic, Nepal Ministry of Health and Population (MoHP) have made projections now and then. The first projection they made was in June 2020, which did NOT come true.
On 21 November, MoHP made their second projection. They estimated 148K ADDITIONAL cases in four months. Cases reported on 21 November was 1674 and the running total was 218K. Assuming that the projection is for March 21 and also assuming a uniform change in the daily cases and therefore running total cases, at what rate would the daily and/or total cases need to change in order to reach that milestone? (Do you know if the prediction came true?)
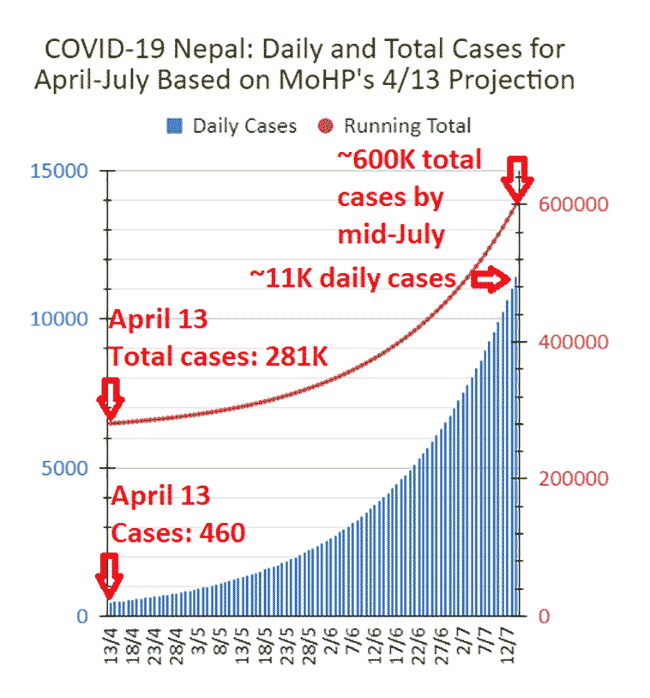
On April 13, MoHP made another projection. Accordingly, the total COVID-19 cases is estimated to hit 600K and daily to be around 11K by mid-July. Based on the data for April 13 (see below), the estimated numbers, and assuming uniform (constant) growth rate, I figured out the daily and total cases leading up to July 15.

Two questions about that.
- What is the daily projected cases for July 1?
- What’s the projected running total cases for June 1?
Barely two weeks into that projection, on April 24, MoHP revised their earlier projection and made a “worst case scenario” projection: 800K ADDITIONAL cases by July 15. On the day of the projection, 2486 cases had been reported, and the caseload stood at 297K. Again, two questions about that.
- Assuming uniform rate of change of the cases, at what rate must the running total grow for the projection to come true?
- In how many days will 400K (half the number of) cases be added to the total?
Embedded below is the live chart tracking the actual daily and total cases. If you calculated the growth rate, you should be able to calculate the daily and running total cases.
- How good a match is the predicted values with the actual? (You can read off the values by hovering your cursor over the relevant data point on the graph.)
- If different, how different are they? In other words, what’s the value of one relative to the other?
Enjoy!
(Incidentally, this is the fifth problem in the series of blog posts about challenging problems. Click here for the first one, here for the second one, here for the third one, and here for the fourth one. And if you are interested in reading about MoHP’s projections and what happened to them, click here. This card problem is about exponential growth and in that way and therefore also about coronavirus. Click here for a description of the reason behind the series and what modeling means.)
