Even while one of the things election data shared in the first blog post in this series (Nepalis Like Their Politician to be Old Khas-arya Male…or Do They?) show that voters APPEAR to prefer (61-100 years) old Khas-arya males for politicians more than the rest (see chart below), that’s not actually the case.
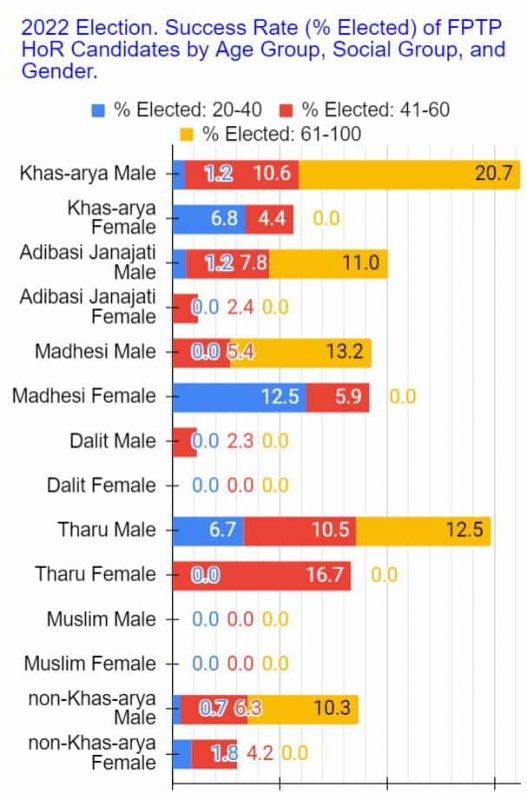
In other words, there are a number of reasons or explanations for the above data.
One of the explanations, but not the ONLY explanation, for SOME of the results of the election is something really basic: statistics.
If you draw out a handful of marbles from a sack containing equal number of black and white marbles (say fifty each), what you have in your hand is likely to be equal number of the two variety. If, on the other hand, you do the same from a sack containing eighty black and twenty white ones, you are likely to draw more black than white, and, if you draw many times, the average ratio will reflect the ratio of the marbles in the sack. That can and does explain some but not all of the results of the election considered in the first blog post in this series.
It, more or less, explains the results of the election disaggregated by age group, for example, with the exception of the results of the old, the 61-100 age group.
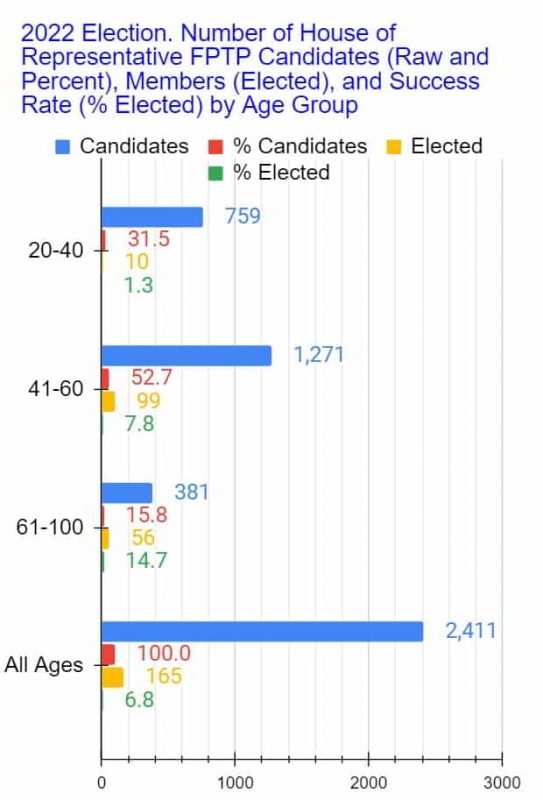
So, naturally, the question is, why were the old so much more successful (14.7% vs 7.8% and 1.3%)? That is, why was there such a disproportionately high percentage of the old in the “sample drawn out,” as it were?
What about the following results?
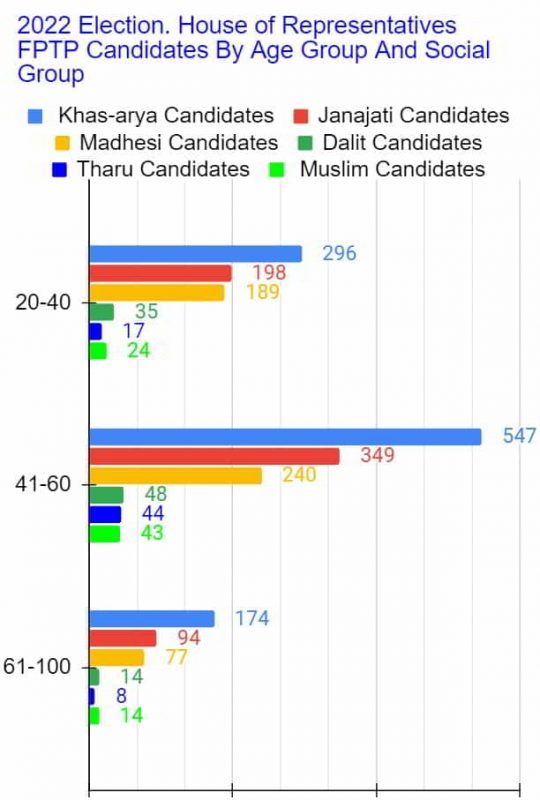
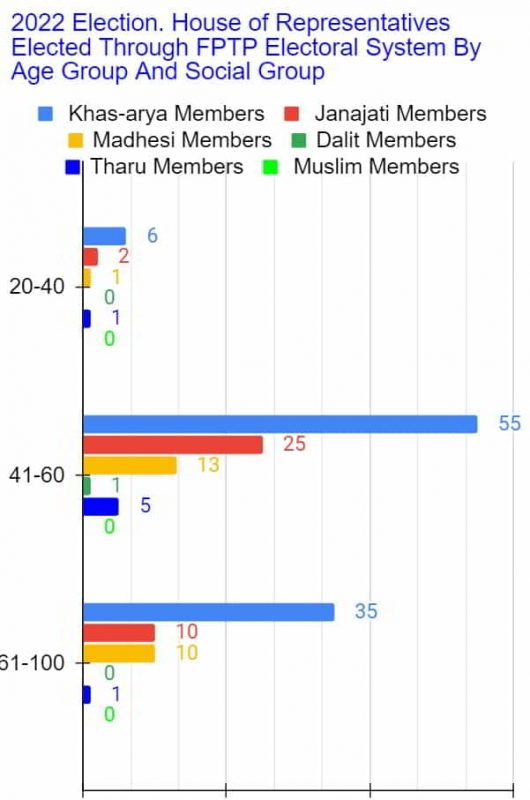
Statistics more or less explains the above results too: the pattern in the bars within an age group in the two charts are pretty much the same. Yes, again, there are exceptions, such as the success rate of the old Khas-aryas this time being so much higher than those of the others. More than 3x as many old Khas-aryas were elected than the Janajatis (35 vs. 10), even though Khas-arya candidates were less 2x the Janjatis (174 vs. 94).
So, now, the more important questions are, why is the representation of the khas-aryas in the candidate pool in every age group the highest in the first place and why were the old Khas-aryas the most successful?
Statistics also explains the following results, again more or less.
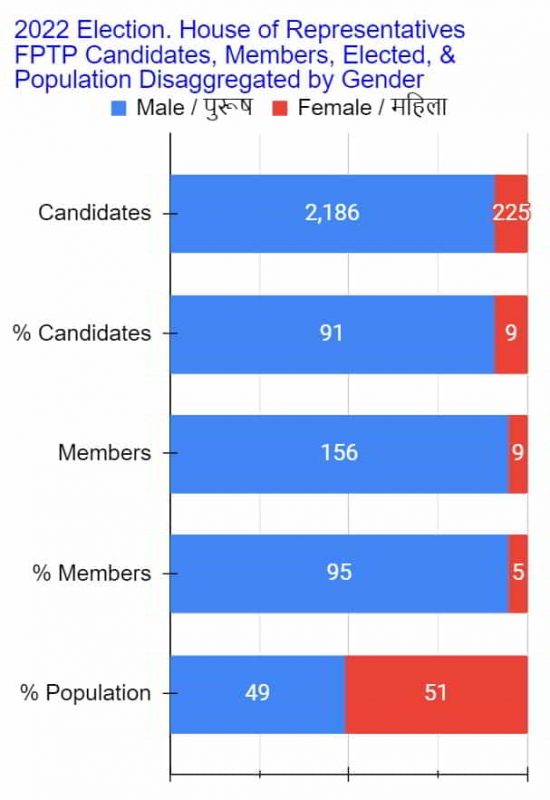
With a candidate pool consisting of a vast majority males (91%), it’s NOT surprising that the proportion of those elected also comprise of a vast majority males (95%).
But, again, the questions are, why is there such a disproportionately high percentage of male candidates to begin with and why did an even higher proportion of males end up in the “sample”?
Disaggregating the above data further, we see the same thing being borne out (see charts below).
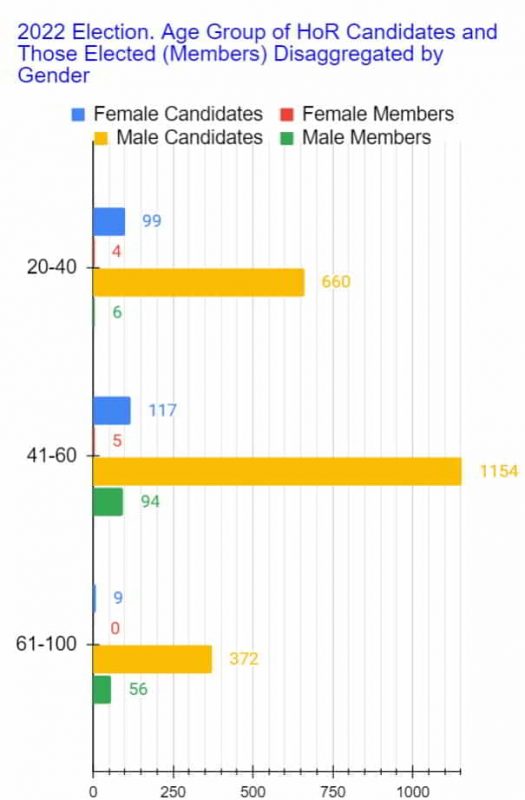
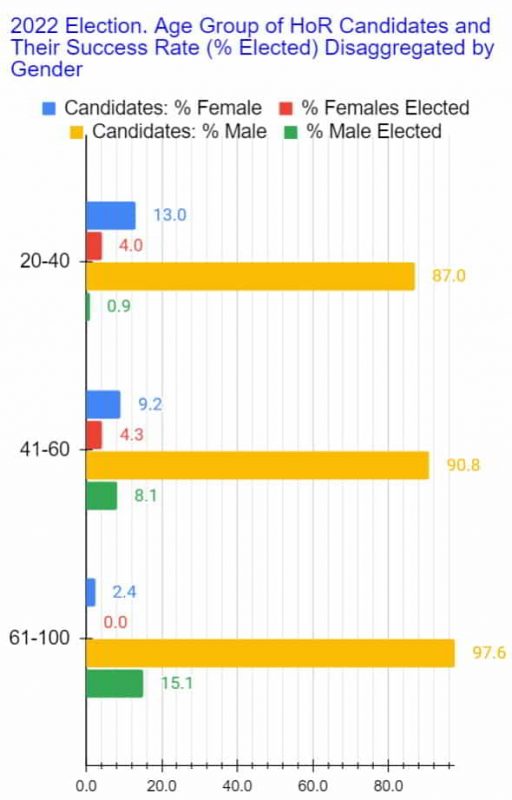
Again, as you can see, more or less but NOT completely.
Of course, there are more anomalies–discrepancies between what one might expect statistically and the results. Have a look at these.
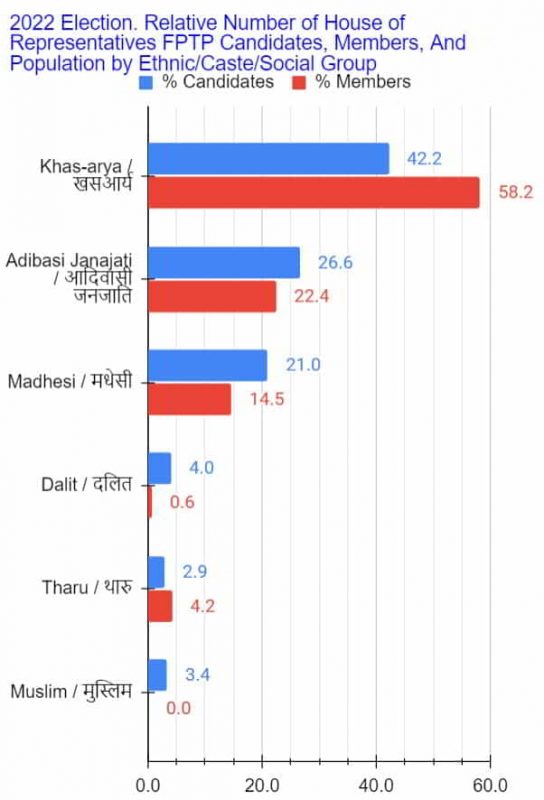
Yes, the proportion of Khas-arya candidates at 42.2% is the highest of all the social groups but following the elections, we ended up with a MAJORITY (58.2%) of Khas-arya FPTP members!
In fact, when the data is disaggregated by just Khas-aryas and non-Khas-aryas (see chart below), the results are even more warped!
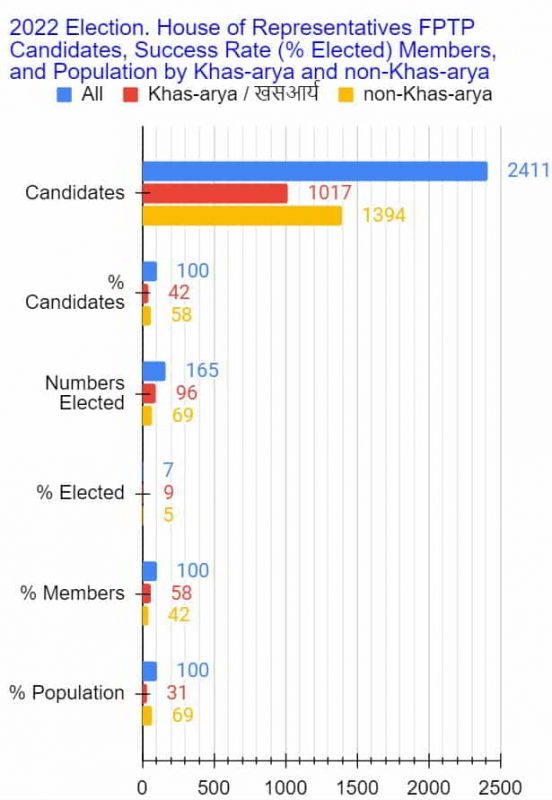
The candidate pool consists of 42% Khas-arya and 58% non-Khas-aryas. However, not only was more Khas-aryas elected (96 vs. 69), their success rate was almost 2x that of the non-Khas-aryas (9% vs. 5%). The result was a 165 FPTP members with the exact opposite make-up: 58% Khas-aryas and 42% non-Khas-aryas!
That’s definitely NOT what one would expect from a random process, like that of drawing out a handful of marbles (members) from a sack containing different colored marbles (candidates). Statistically, that would be like having a sack full of forty-two black and fifty-eight white marbles but when randomly drawing out a handful of ten ending up with six black and four white ones! What are the chances of that happening? Miniscule.
The reason statistics is unable to explain them all, or the reason some of those results are different from what statistics would predict, is essentially that an election is NOT a random process like drawing a small sample of marbles from a sack full of them, obviously. A lot more is involved effecting results such as those.
To reiterate, we have to find explanations for the disproportionately high representation of an age group (the old), a social group (Khas-aryas), and a gender (males) in the pool of candidates to begin with. Following that, we got to find an explanation for the anomalous results–why some demographic have had higher than expected success rate resulting in a disproportionately high and, in a case or two, even higher–representation in the FPTP members.
(I’ll have more to say about the comparison with the population–bottom entry in the chart above–in another blog post.)
And for that, we’ll need to dig deeper by conducting further analysis of the election data and exposing the following, something I ended the first blog post in this series with.
“Overall, however, those results are all consequences of the “democratic” process of election in Nepal–the official and unofficial systems that create and enforce the rules and regulations of the process, the political institutions involved, and, most importantly, who mostly have had and continue to have the power in those institutions to make the critical decisions that directly or indirectly affect, or rather pre-determine, the outcomes of such elections, and why.”
You’ll have to wait for that and more in the rest of the follow-up blog posts.
