In the first two blog posts in this series (Nepalis Like Their Politicians to be Old Khas-arya Males…or Do They? and Nepali Voters, Old Khas-arya Male Politicians, and Statistics), it was established that Nepali voters APPEAR to prefer old Khas-arya men politicians the most–their success rate is the highest–and statistics is able to explain some results of the election but NOT all.
In this blog post I shall show you how, as if electing disproportionately more of the old Khas-arya men–the 61-100 year-old Khas-arya men–over every other demographic wasn’t bad enough to begin with, the composition of the 165 FPTP members of the House of Representatives (HoR) is so warped that, relative to their proportion in the population, several demographics are over-represented while the rest are either under-represented or not represented at all.
The basis for that conclusion will be a comparison of the elected numbers with numbers in the following chart, one that breaks down the population as a proportion of the specific demographics of interest.
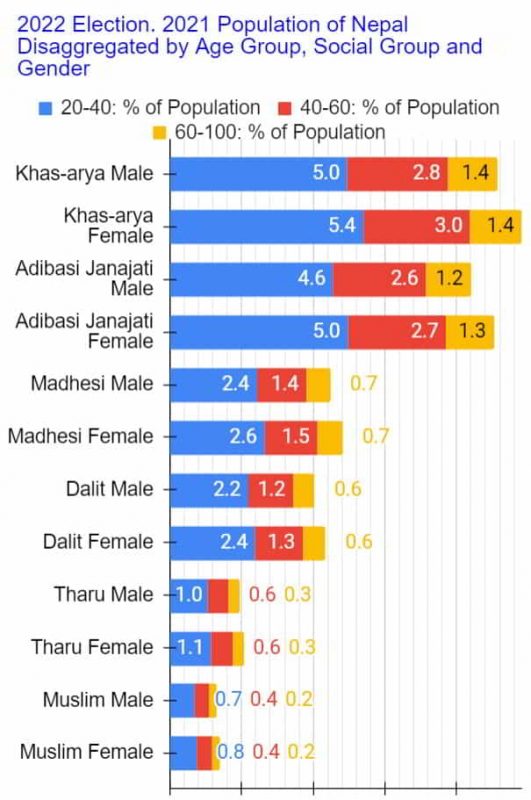
The most represented population among this group (at 5.4%) is the Khas-arya females followed by the Khas-arya males and Adibasi Janajati Females (both 5.0%). Note, old Khas-arya males represent only 1.4% of the population. Keep that in mind when looking at the charts that follow.
Now, let’s start with a comparison of the candidates, their success rate, the HoR members and, this time, their numbers in the population.
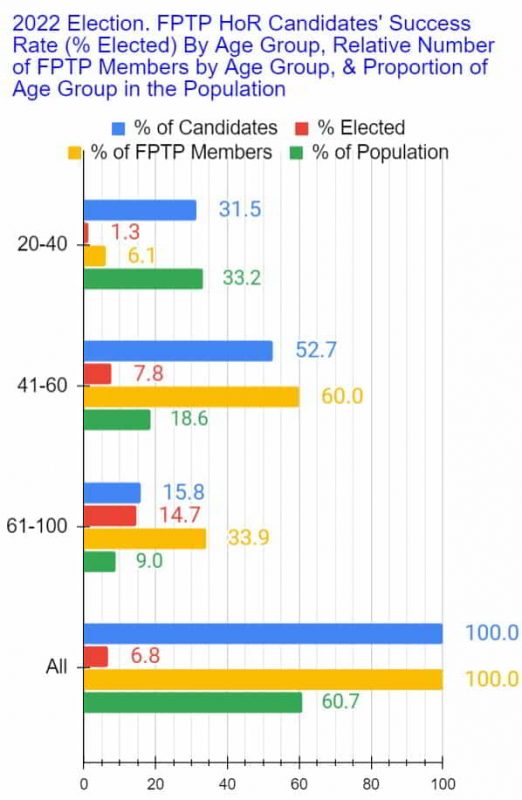
While 20-40 year-olds are the most represented age group in the population (33.2%), the 41-60 year-old group is the most represented demographic in the candidate pool (52.7%). The proportion of the latter in the pool of candidates is more than double their proportion in the population (52.7% vs. 18.6%). When it comes to the old, their proportion in the candidate pool is more but not quite twice that of their proportion in the population (15.8% vs. 9.0%). The proportion of 20-40 year-old candidates and their proportion in the population, on the other hand, are comparable (31.5% and 33.2%).
However, for reasons I have yet to reveal, the old, at 14.7%, had the highest success rate, followed by the 41-60 year-olds (at 7.8%). The 20-40 year-olds achieved a success rate of only 1.3. Consequently–and this is the most important point–the old ends up with the highest proportion of members: 33.9%, which is more than four times their proportion of 9.0% in the population.
Let’s look at social group numbers and compare them to their proportion in the population.
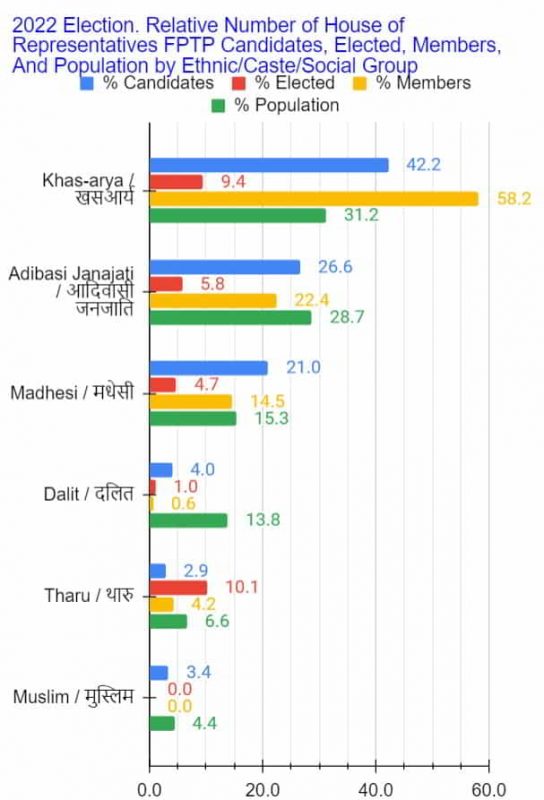
Only two social groups had a disproportionately higher proportion of candidates than their proportion in the population: the Khas-aryas and the Madhesis. The former accounted for 42.2% of the candidates when they account for only 31.2% of the population while the latter accounted for 21.0% of the candidates when they account for only 15.3% of the population. But the much higher success rate of the Khas-aryas (9.4%) meant that they ended up with even higher proportion of the FPTP members. At 58.2%, not only are they a majority, they are almost twice as much represented in the FPTP members as their proportion in the population (of 31.2%). As for the other social groups, forget a disproportionately higher representation, every single one is under-represented.
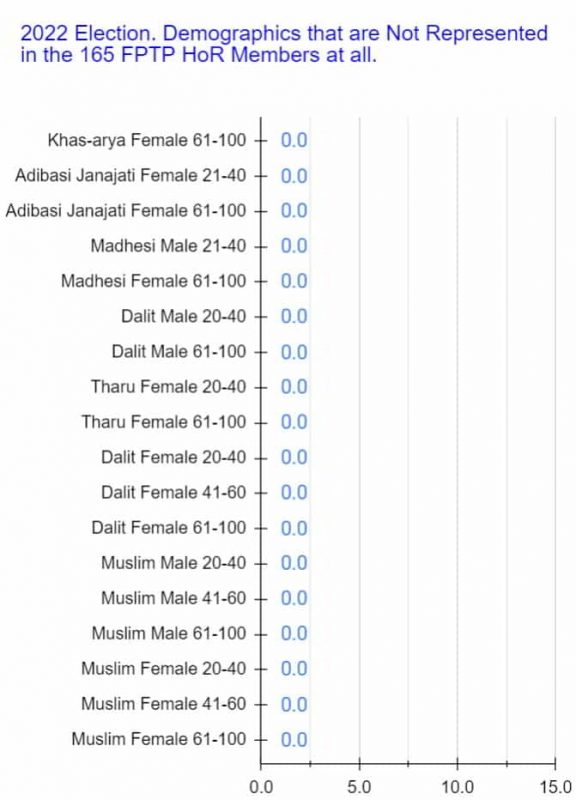
Muslims have zero representation.
And what of the gender perspective?
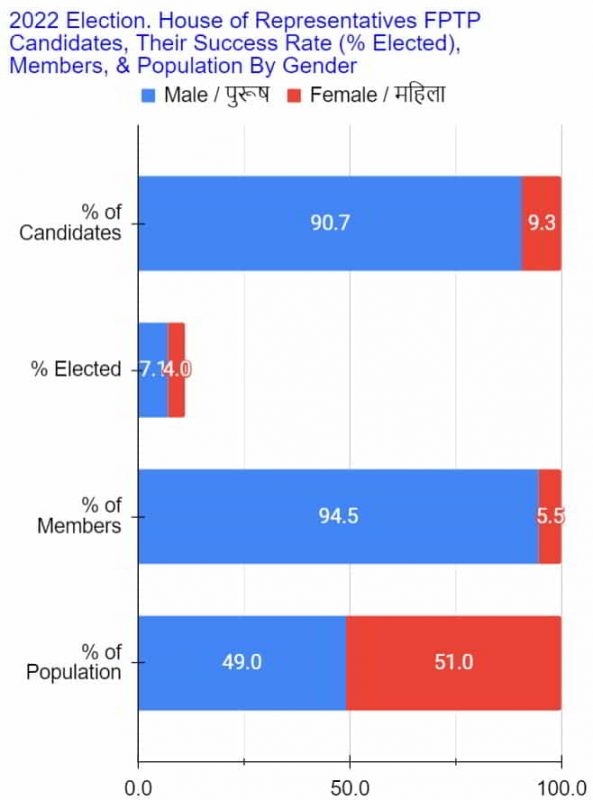
Suffice it to say that males are diproportionately over-represented and females severely under-represented. While the representation of males in both the candidate pool and FPTP members is disproportionately high–90.7% and 94.5% vs. 49.0%–the female numbers are a FRACTION of their proportion in the population (9.3% and 5.5% vs. 51.0%).
Moving on to a breakdown of the candidate pool by social group, gender, and age group….
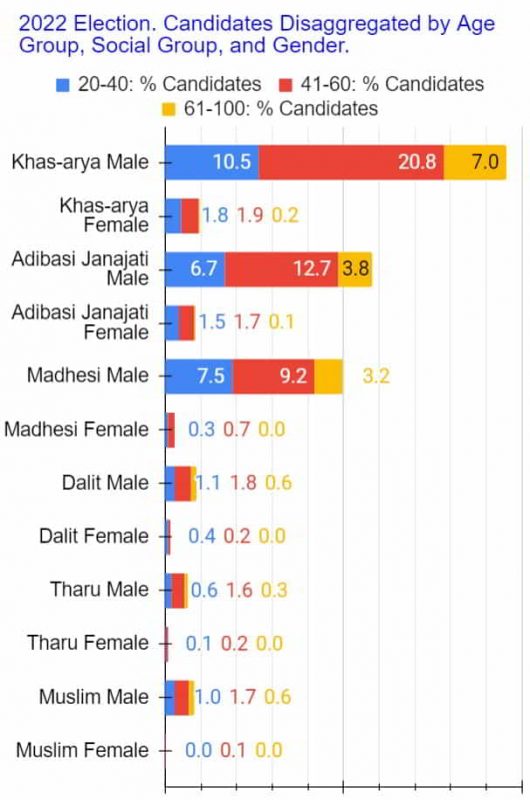
The Khas-arya Males, Adibasi Janajat Males, and Madhesi Males are disproportionately highly represented in the candidate pool. For example, the 20-40 year old Khas-aryas represent only 5.0% of the population (the first chart in this blog post) whereas they represent 10.5% in the candidate pool! Similarly, the old Madhesi males account for only 0.7% of the population but 3.2% of the candidates. But, the important numbers to note are for old Khas-arya males: 1.4% vs. 7.0%.
In the first blog post in this series, it was established that, at 20.7%, the old Khas-arya males had the highest success rate (see chart below).
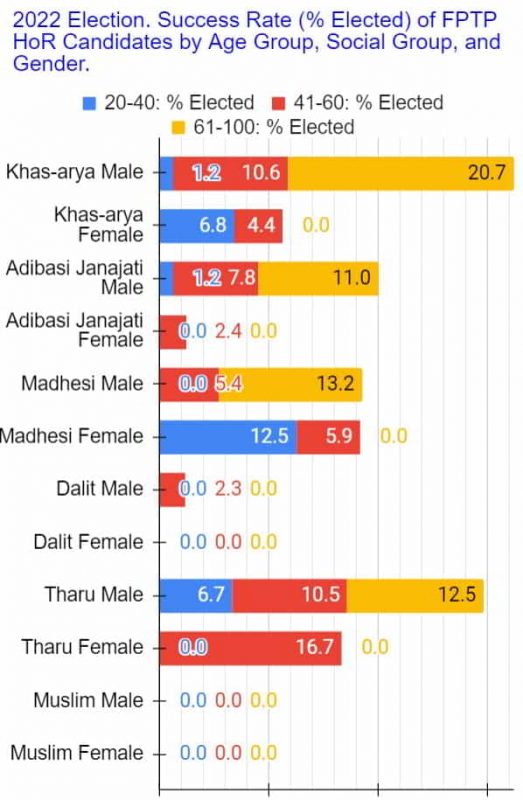
A consequence of all that? A very warped 165 FPTP members of the House of Representatives, as was alluded to in the beginning!
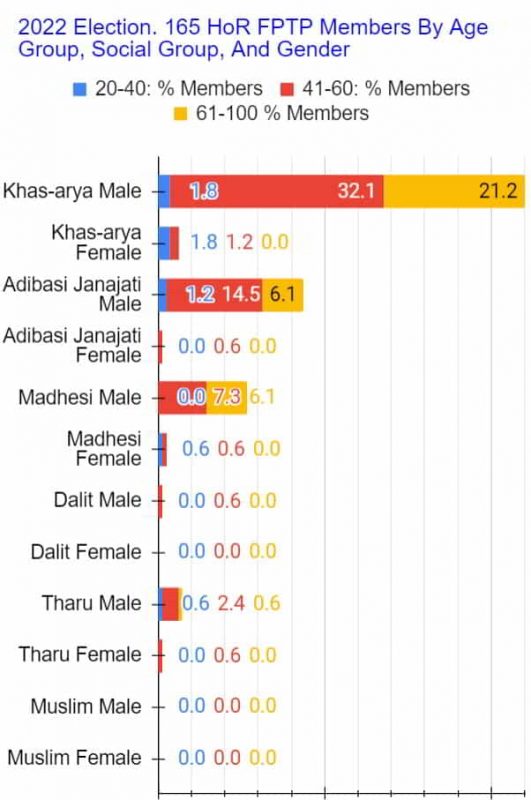
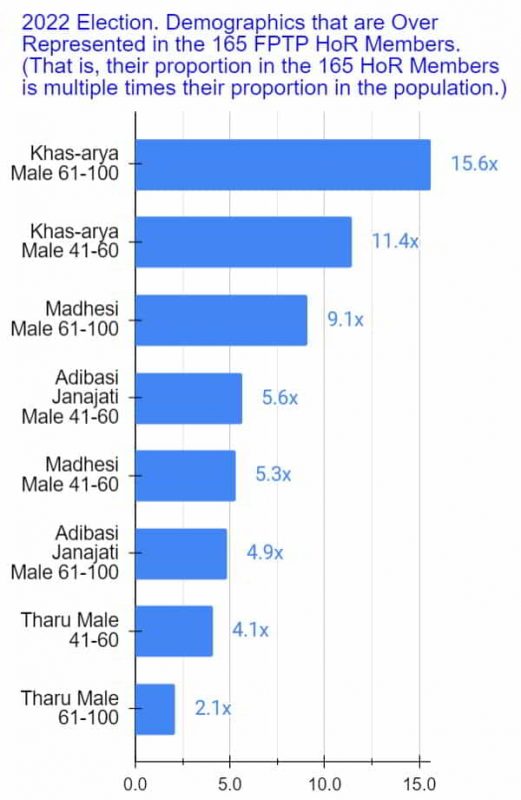
At 32.1% the 41-60 year-old Khas-arya males are the most represented in the 165-strong body, followed by the old Khas-arya males (at 21.2%), who in turn are followed by the 41-60 year-old Adibasi Janjati males (at 14.5%). But remember that the proportions of 41-60 year-old Khas-arya males, the (61-100 year) old Khas-arya males, and that of the 41-60 year-old Asibasi Janjati males in the population are just 2.8%, 1.4%, and 2.6% respectively. In other words, relative to their proportion in the population, they are over-represented. How much are they over-represented by? See chart below.
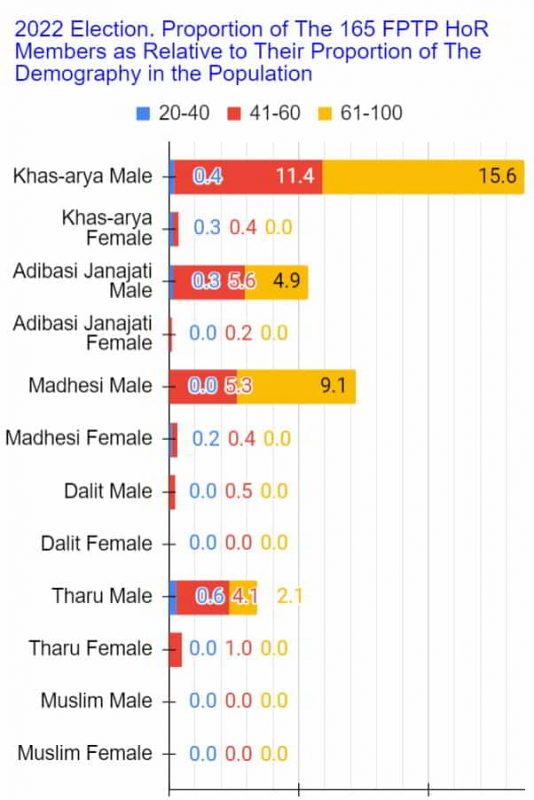
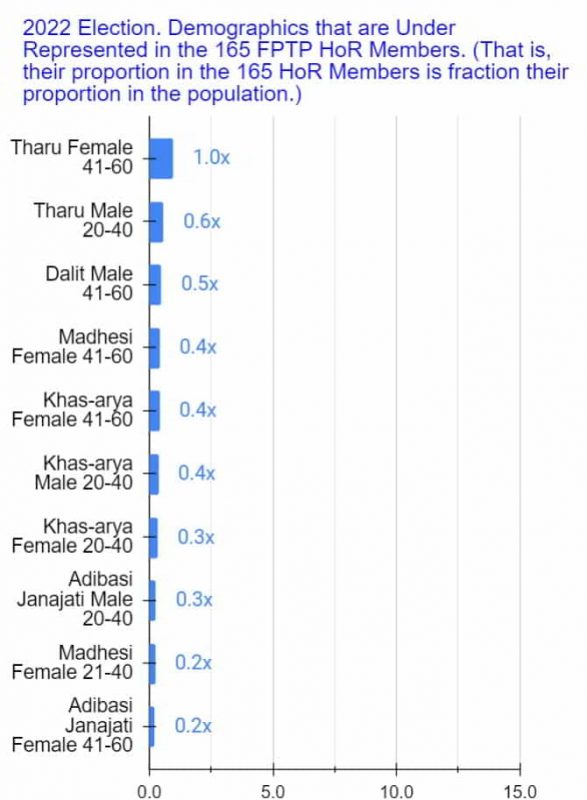
Not surprisingly, the old Khas-arya Males are over-represented the most followed by the 41-60 year-old Khas-arya males. The former account for only 1.4% of the population (first chart in this blog post), but their representation in the 165 FPTP members stands at 21.2% (chart preceding the one above) resulting in their representation being equal to 15.6 times their proportion in the population (21.2/1.4=15.6). The 41-60 year old Khas-arya males’ representation is 11.4 times their proportion in the population (32.1/2.8=11.4). All demographics with number greater than one in the above chart have over-representation. Those with a number between 0 and 1 are under-represented. Finally, those with 0 are not represented at all.
As if what the above data show wasn’t bad enough, in the second blog post in this series, I shared the following chart to show you how much further warped the results are–one in which the data is divided into just two, Khas-arya and non-Khas-arya.
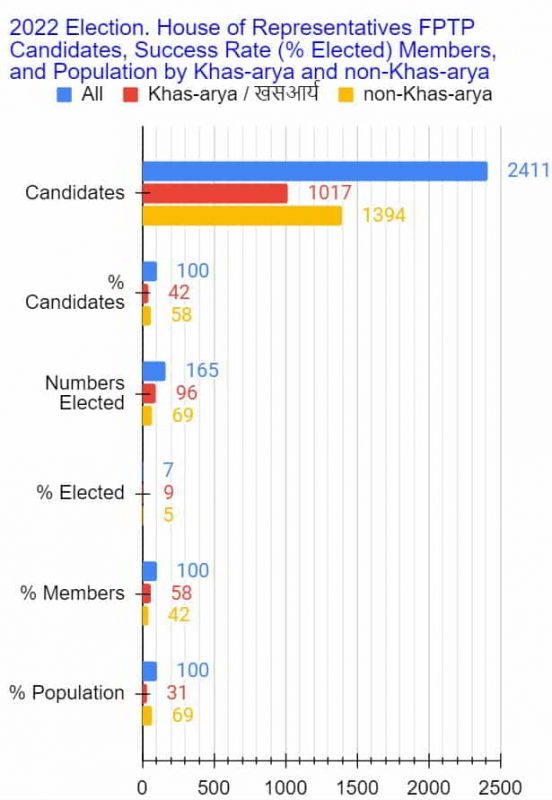
Here’s more on that.
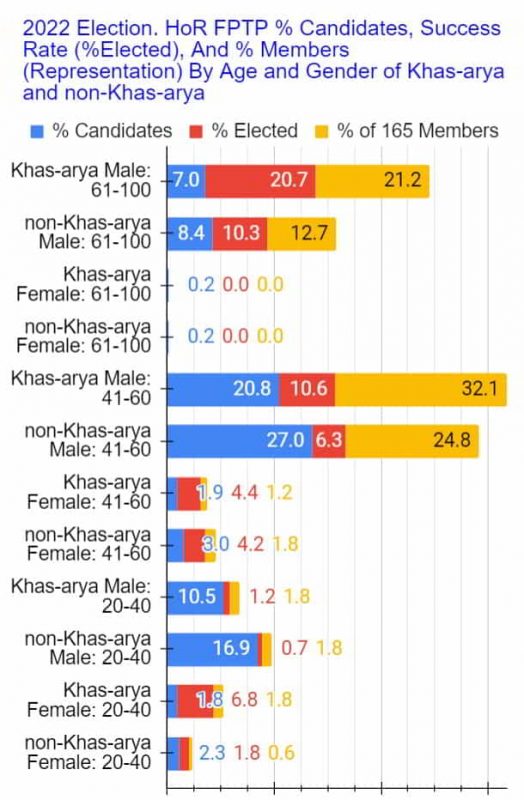
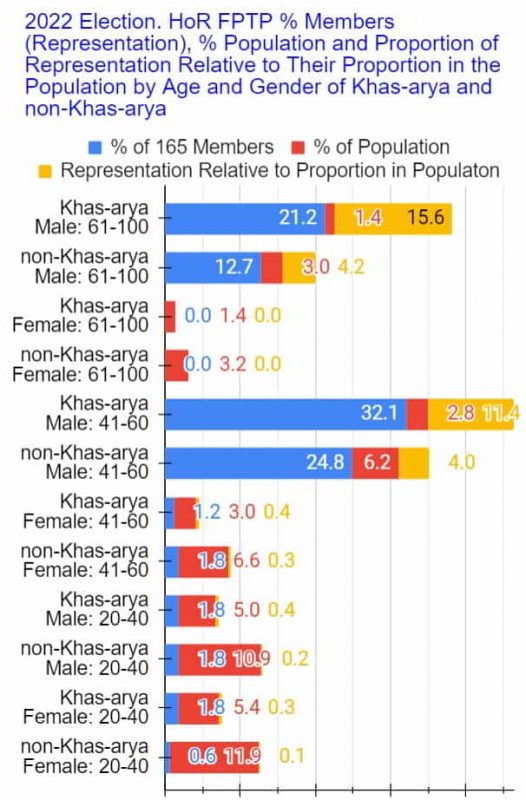
What do you notice? Pretty warped still! I say still because, as you know, in every demographic charted above, proportion of non-Khas-aryas is more than double that of the Khas-aryas in the population (the numbers in red) and yet their representation relative to their proportion in the population (the numbers in orange) is lower than that of the Khas-aryas with the ONLY exception of the (61-100 year) old females–neither have ANY representation, they both are equal to 0!
Here are three cleaner charts showing the demographics and their representation in the 165 FPTP members of the HoR.
What’s so incongruous about the old Khas-arya males “representing” the population and making all the policies, laws etc. the way they have always done? Among the most important reasons why having them in the driver’s seat, as it were, has been and continues to be a disservice to the country is the fact that they are a group that grew up in a world without TV, mobile phones, and the internet. This is the century of social media, virtual reality, and AI. What are the chances that all of them or a majority of them are out of touch with the world we live in now? I would guess very high!
In other words, those making decisions and shaping the world of Nepal for the population of the country in the twenty-first century represent a demographic who are least likely to be able to prepare the country and the population for the rest of the century, forget beyond.
To demonstrate how these old dinosaurian Khas-arya males are out of touch with the world we live in now and how detrimental that can be, here’s a recent example. Several months ago, the old Khas-arya male top leaders of three political parties in the coalition government, in consultation with Cyber Bureau and Home Ministry, banned TikTok.
Another reason the old Khas-arya men leading the country is detrimental to the country? Their sense of entitlement makes them work against inclusive political institutions and against inclusive economic institutions, both of which has already had devasting consequences for the country. Until 2020, Nepal was one of the five poorest countries in the world, and we continue to be one of the most corrupt if not the most corrupt in Asia, for example.
One of the many reasons the old Khas-arya males are disproportionately highly represented in the 165 FPTP House of Representatives members is that they themselves have been and continue to be the leaders of the biggest and most powerful national political parties. The reason that in itself is yet another major issue for the country is that, in Nepal, it’s political party above the country, and the top leaders of these political parties above the political parties. That’s one reason the leaders were able to make laws banning TikTok so readily and quickly.
As for the rest of the reasons behind how and why we have the warped representation that we do…here’s a reproduction of what I concluded the other two blog posts in this series with:
“Overall, however, those results are all consequences of the “democratic” process of election in Nepal–the official and unofficial systems that create and enforce the rules and regulations of the process, the political institutions involved, and, most importantly, who mostly have had and continue to have the power in those institutions to make the critical decisions that directly or indirectly affect, or rather pre-determine, the outcomes of such elections, and why.”
For the details, you’ll have to wait for the rest of the follow-up blog posts.
