If we go by the results of the recent 2022 election for the 165 members of 275-strong House of Representatives elected through the First Past The Post (FPTP) electoral system, Nepali voters APPEAR to like their politicians to be old Hill so-called High Caste Hindu (Khas-arya) males. But is that actually the case or is something else going on? If some other things are at play, what?
In a series of blog posts, starting with this, I shall be sharing the analysis of relevant 2022 election data and potential explanations for what the data show.
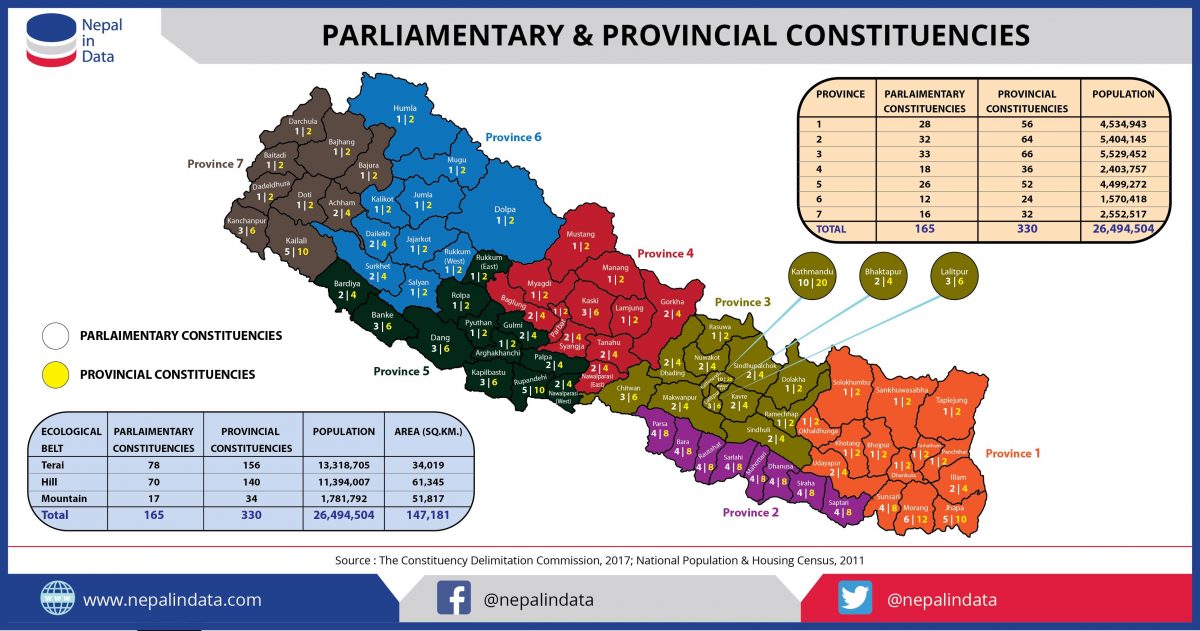
First, some basic information. The FPTP members are selected by 165 constituents in the country (see image below).
| Total Parliamentary Constituencies: | 165 |
| House of Representatives: | 275 |
| HoR Members elected through FPTP electoral system: | 165 |
| Number of political parties fielding FPTP candidates: | 63 |
| Total FPTP Candidates: | 2411 |
| Number of political parties represented in 165 members elected through FPTP electoral system: | 13 |
In order to find answers to those questions, data will be disaggregated by age, social group, and gender of the candidates and by analyzing for their success rate, percentage elected.
Here’s the first bar chart showing the candidates and members disaggregated by age group and their success rate.
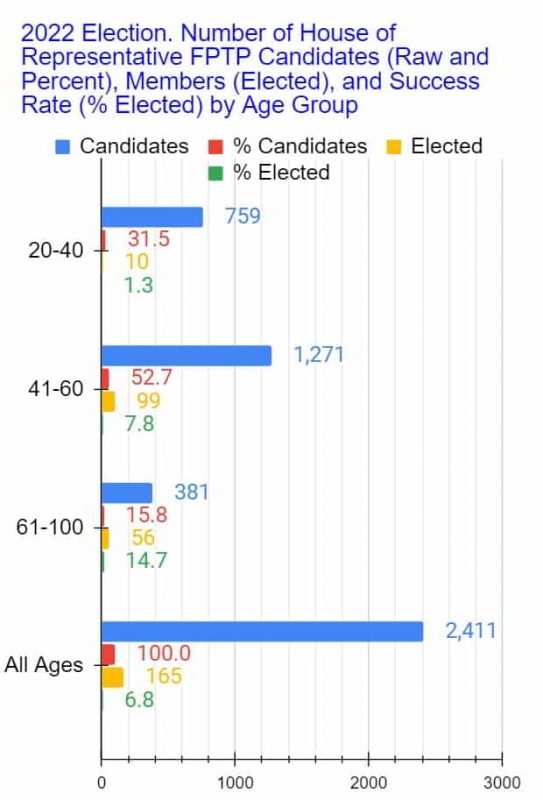
As you can see, the most represented age group in the pool of candidates was the 41-60 year-olds (52.7%) and the most number of candidates elected was also from the 41-60 year-olds (99), which, of course, is NOT surprising given the make-up of the candidates by age (something I’ll have more to say in follow-up blogs).
However, the old–the term I shall use to refer to the 61-100 age group–had the apparent highest success rate (14.7%). Furthermore, its success rate is almost twice that of the second highest, that of the 41-60 age group (7.8%).
So, when it comes to the age of our representatives, Nepalis APPEAR to prefer the old the most.
Let’s looks at Social Groups. The following chart shows the candidates disaggregated by social group and their success rate.
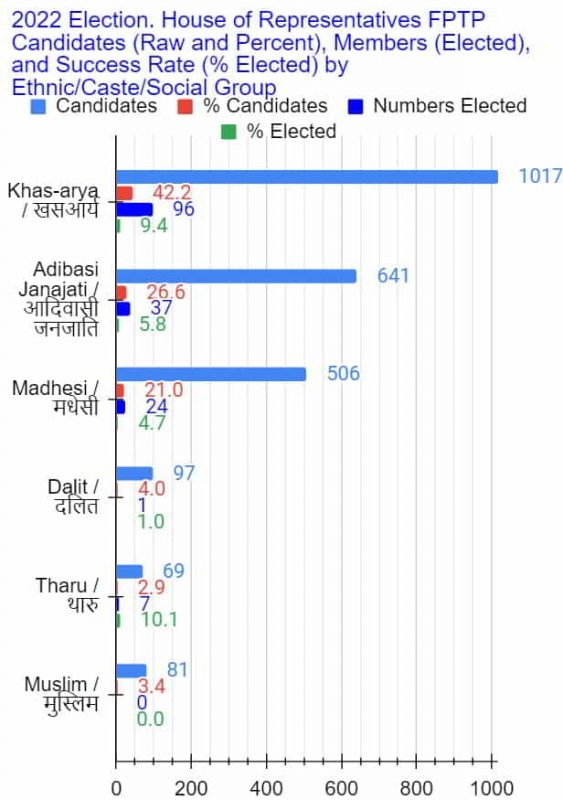
Nepali voters elected Khas-aryas at rate 1.6x higher than Janajatis (9.4% vs. 5.8%). They voted in Khas-aryas at rates 2x higher than Madhesis (9.4% vs. 4.7%). When it comes to Khas-aryas vs. Dalits, their preference for the former was almost 5x than the latter (9.4% vs. 1.9%).
When it comes to Khas-aryas vs. Tharus, however, voters APPEAR to prefer the latter. But of course, The Tharus’ success rate here is misleading; there’s a simple explanation for that discrepancy. To begin with, Tharus contesting the election is not only small (69) but also ONLY a fraction (~7%) of that of the Khas-aryas. Furthermore, they were likely only contesting in areas they are native to.
Nepali voters rejected EVERY SINGLE Muslim candidate.
So, when it comes to the social group of our representatives, Nepalis APPEAR to prefer Khas-aryas the most.
Moving on to gender….
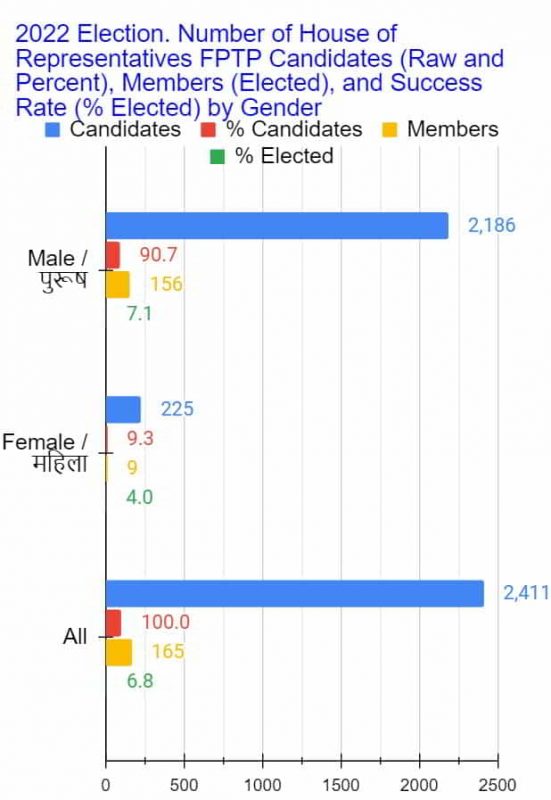
Of course, what the chart above shows is NOT at all surprising given how highly patriarchal and misogynistic Nepali society and population are. Only a fraction of candidates are female (225 vs. 2186) for a number of reasons, one of which is that vast majority of the 63 political parties contesting in the election are led by men, if not ALL. I would NOT be surprised if a majority of the 225 female candidates are actually independent candidates–ones NOT affiliated with ANY political party. It’s not at all a surprise, therefore, that only 9 were elected and their success rate stands at just 4.0% while that of the males is almost double (7.1%).
Anyway, Nepalis voters APPEAR to prefer male politicians over female.
Let’s take a step back and take stock of what has already been established so far. When it comes to the age of their politicians, Nepali voters prefer the old (61-100) the most. When it comes to social group, Nepali voters prefer Khas-aryas over candidates of other ethnic/caste/social group. Finally, when it comes to gender, Nepali voters overwhelmingly prefer males over females.
Let’s look at further disaggregated data. The chart below shows the age groups of the 165 members broken down by Social Group.
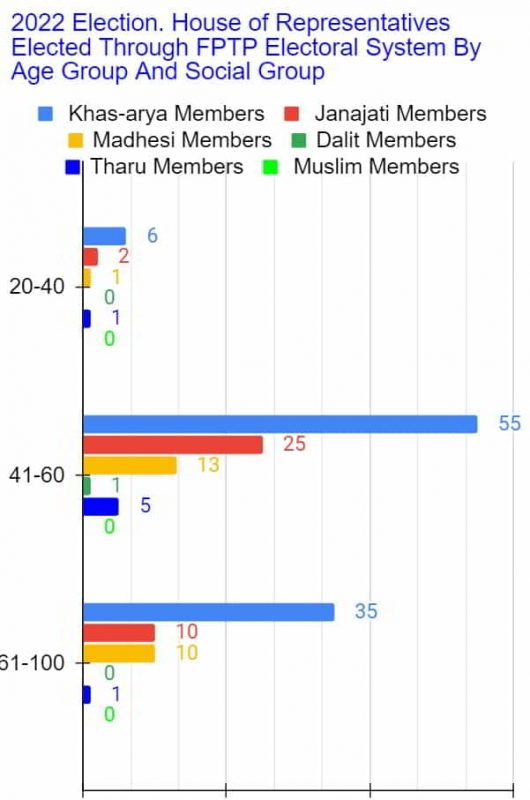
As you can see, within every age group, the highest number of candidates elected were Khas-aryas, the blue bars (6, 55, and 35).
But what of their success rate? That is, what proportion of candidates of each social group within an age group were elected?
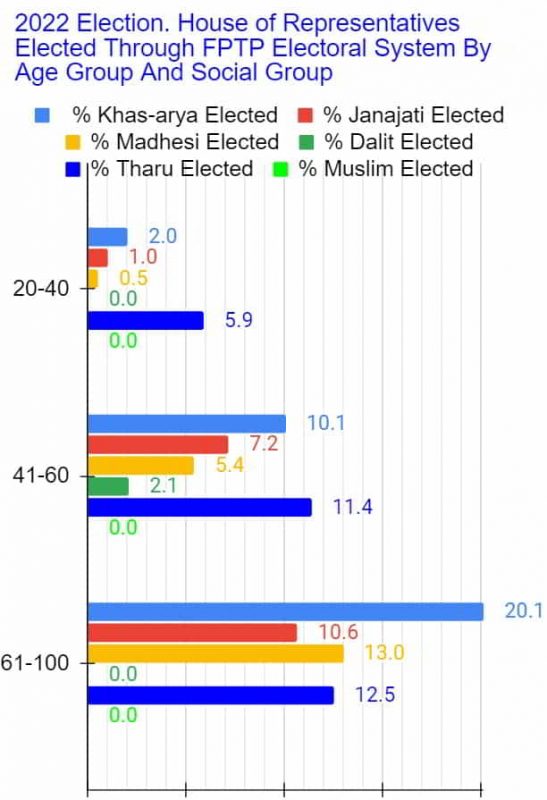
At 20.1%, the (61-100 years) old Khas-aryas had the highest success rate. That is Nepali voters appear to have a preference for old Khas-aryas. (I have already mentioned the potential explanation for the unusually high success rates of Tharu candidates.)
Disaggregating the age group of candidates by gender, we get the result below…though, based on the data already presented, what they show should be NO surprise.
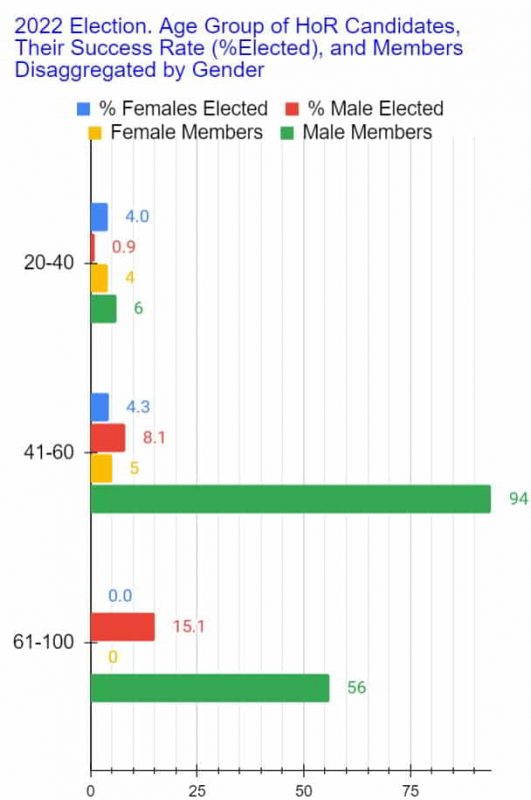
While the number of 41-60 year old males elected is the highest (94), at 15.1%, the (61-100 years) old males had the highest success rate.
And, finally, what do we get when we zoom in further? That is, what do we get when the above data–disaggregated by age, social group, and gender–are all combined into one?
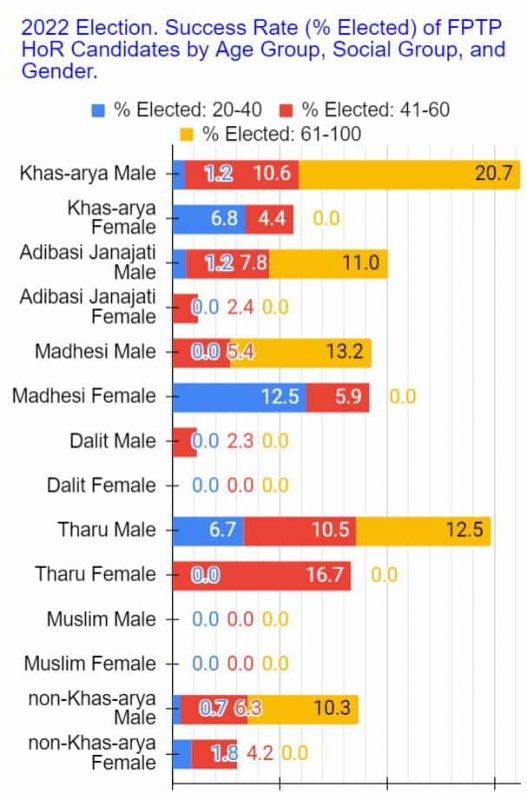
As you can see, at 20.7%, the old Khas-arya males had the highest success rate. In other words, Nepali voters prefer old Khas-arya males the most…or do they?
Well, to state the obvious, of course, the results are not really a reflection of the voter’s overall preference. One of the explanations, but not the ONLY explanation, for SOME of the data showing what they show is something really basic: statistics, which will be the topic of the next blog post in the series.
Overall, however, those results are all consequences of the “democratic” process of election in Nepal–the official and unofficial systems that create and enforce the rules and regulations of the process, the political institutions involved, and, most importantly, who mostly have had and continue to have the power in those institutions to make the critical decisions that directly or indirectly affect, or rather pre-determine, the outcomes of such elections, and why.
But for all that, you’ll have to wait for the rest of the follow up blog posts.

