They say you should look at the streets to get a sense for what the country is like.
Observe the streets of Kathmandu and, no doubt, you’ll notice how little regard and concern the drivers have for the most vulnerable: the pedestrians. The drivers, far from prioritizing the safety of the pedestrians first and foremost, actually put the latter’s lives in danger, more often than not. That truly reflects the attitude of the majority in the country — from average Joes and Janes to those with any kind of power and influence as well as that of the State as a whole — towards the weakest and the most vulnerable. Forget cater to them!
After all, pretty much the entire social, economic and political edifices in Nepali society have been — and continue to be — extractive and exploitative, built by design to rely on as they are in inequity.
No different from the quakes of 2015, the unprecedented Coronavirus pandemic has demonstrated that dramatically, again! Many different pandemic data reveal that, one of which happens to be inoculation against COVID-19, the disease caused by the Coronavirus.
Towards the end of January 2021, the country initiated their vaccination drive against the disease. The Ministry of Health and Population (MoHP) made public for the first time vaccination data broken down by Province only in their COVID-19 July 2 Situation Report, however.
Before going on to a discussion of the charts, a disclaimer about the data. COVID-19 data MoHP publishes is limited in both quantity and quality. Additionally, population data used in the charts is based on the 2011 Census Report.
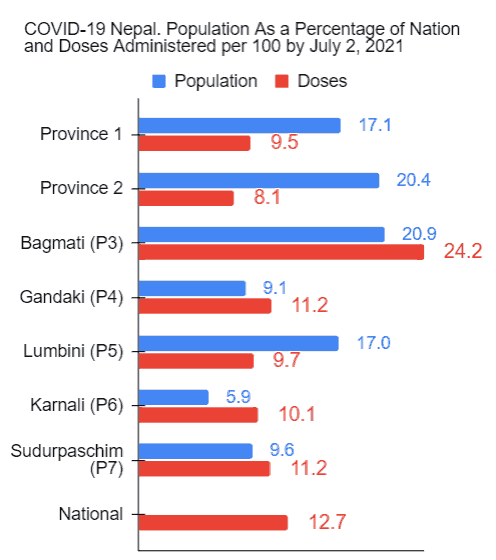
So, by July 2, more than five months later, 79% of available vaccines had been administered but disproportionately (see image below).
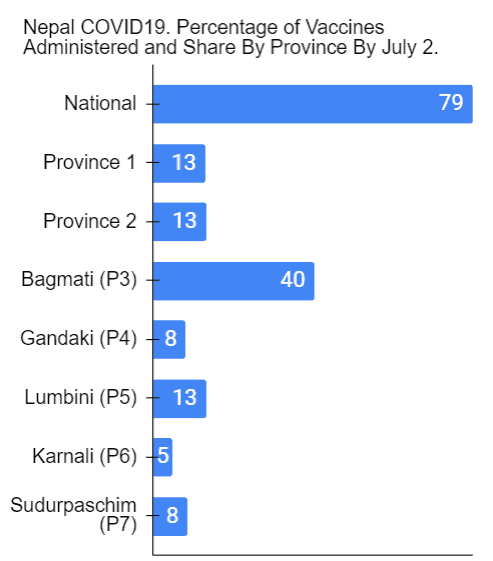
Bagmati, representing about 20.9% of the population of the country, had received the lion’s share of the vaccines–almost half! Province 2, which, at 20.4%, represents almost the same number of people, had received less than a third of Bagmati.
The following chart, which includes population data, further breaks down the vaccines the Provinces received into the first and second/full doses.
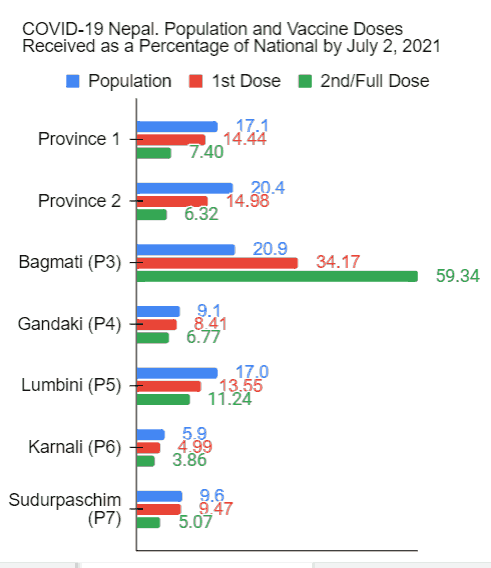
At 6.3 percent of the national second doses/full vaccines administered (green bar above), Province 2 had received about the same share as Gandaki (6.8%) and only a little more than Sudurpaschim (5.1%).
What’s the issue? The issue is that Province 2 has twice the population of each of the two.
Lumbini’s share was also twice as many (11.2%) as Province 2 even though it’s 3% less populous.
So naturally, for that reason vaccinated population in each of the provinces also vary significantly (see chart below).
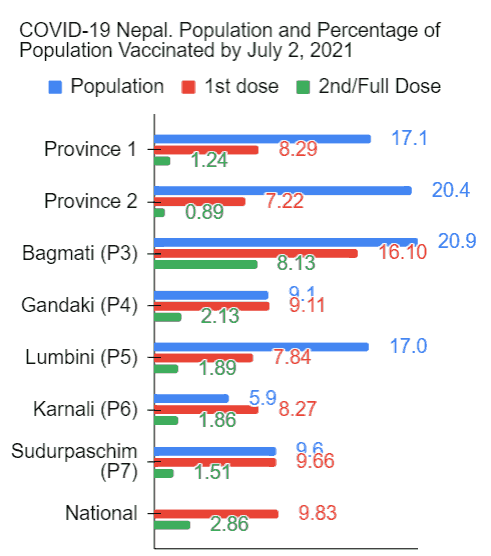
Because of the large population of Province 2, the share of the vaccines they received was relatively so low that the Province ended up as the population with the LOWEST rate of vaccination! Only 7.22% and 0.89% of the population in Province 2 had received their first and the second — or full — dose respectively!
Karnali, with a population almost 1/4th of Province 2 (5.9% vs. 20.4%), TWICE the proportion (1.86% vs. 0.89%) had been fully vaccinated by then!
Another way to look at the data is doses administered per 100 people. Province 2 (at 8.1) had received the LEAST number of doses of COVID-19 vaccines per 100 people (see image)!
(Doses per 100, by the way, is different from the percentage of fully vaccinated population. Let’s say, in a population, 9% have received ONLY the 1st dose and 8% are fully vaccinated, of which 7% received the two-dose variety (for example, Covieshield) and 1% received the one-dose variety (for example, Janssen). The total number of doses administered per 100 then would work out to 24 (9 + 7 x 2 + 1).)
So that was July 2. How have things progressed since? Here’s how (see chart below).
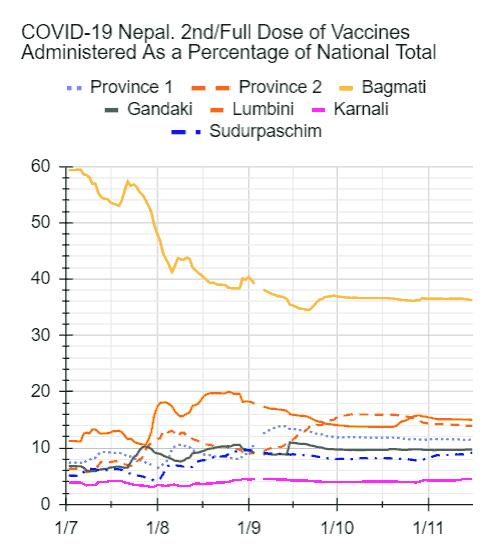
Notice the proportion of the vaccines Bagmati received (orange curve) decreased while those of others increased! Karnali’s (pink curve) is the only one that does not appear to have increased!
Obviously, there has been growths in the number of vaccines administered. Here’s a look at growth over three intervals.
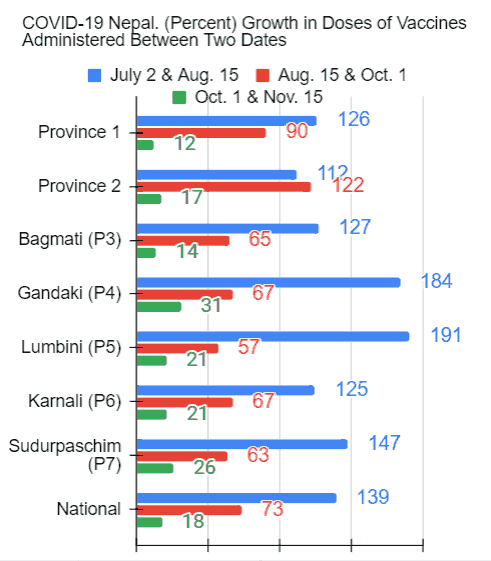
In the period July 2 to Aug. 15, Province 2, at 112%, saw the LOWEST growth! Interestingly, in the period Aug. 15 to Oct. 1, it saw the highest growth. In the period Oct. 1 to Nov. 15, Province 2’s growth was around the national average.
HOWEVER, because the actual number of vaccine already administered in Province 2 were relatively so much lower to begin with that the cumulative results was for the growths to NOT significantly improve their populations’ vaccination levels, as you shall see.
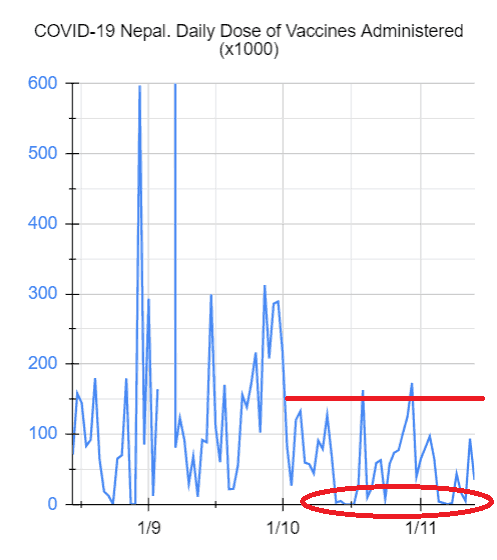
The massive drop in growth over the Oct. 1-Nov. 15 period (green bars in the above chart), incidentally, was due to the country scaling down the vaccination drive (horizontal red line in the chart below) and even not administering any vaccines during some days of the Hindu festivals of Dassain and Tihar (red circles in the chart). If you ask me, another evidence of incompetence and negligence!
Returning to the discussion of growth…to begin with, have a look at the share of the national doses administered in each Province by three different dates (see image).
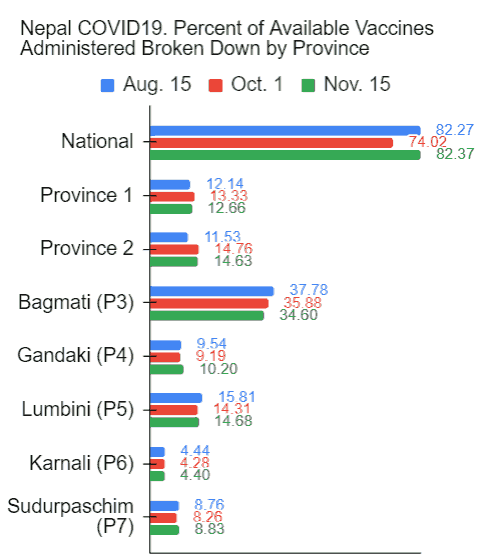
As you can see, there does NOT appear to have been significant changes in the pattern of allocation of vaccines to the Provinces.
Not surprisingly, the percentage of those who have received their first dose and those fully vaccinated in Province 2 did NOT change much relative to the others (see chart below).
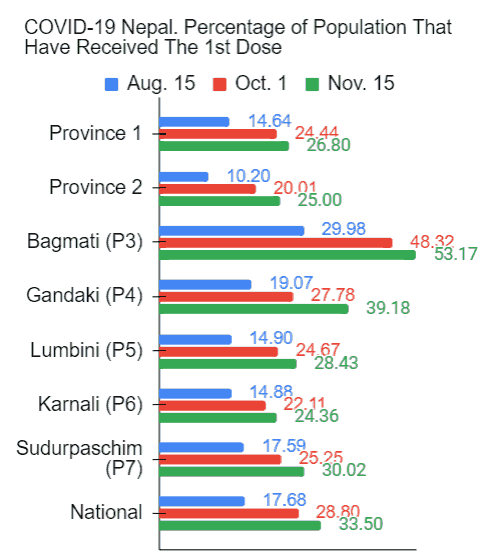
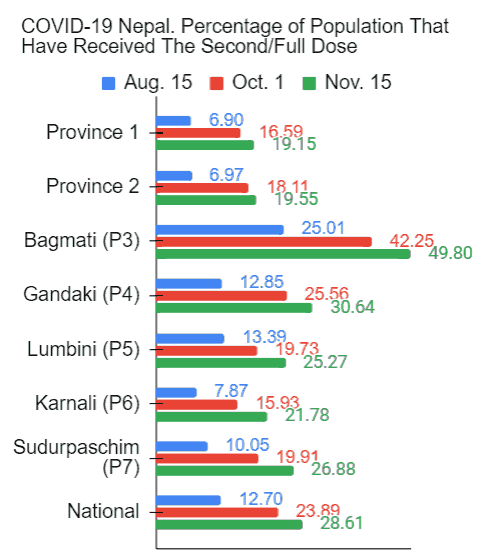
As a matter of fact, even while accounting for 20% of the population of the country, as of November 15, Province 2 has the dubious distinction of being the Province with the second lowest percentage of population who have received just their first dose (25.00%) after Karnali (24.33%), and also the second lowest percentage of population who are fully vaccinated (19.55%) after Province 1 (19.15%).
Here’s the worst though (see chart below).
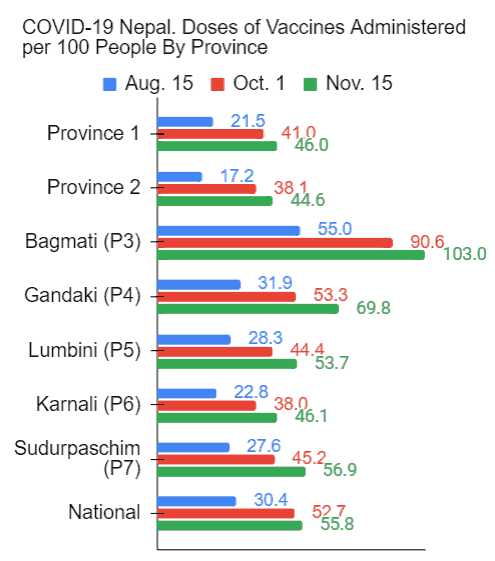
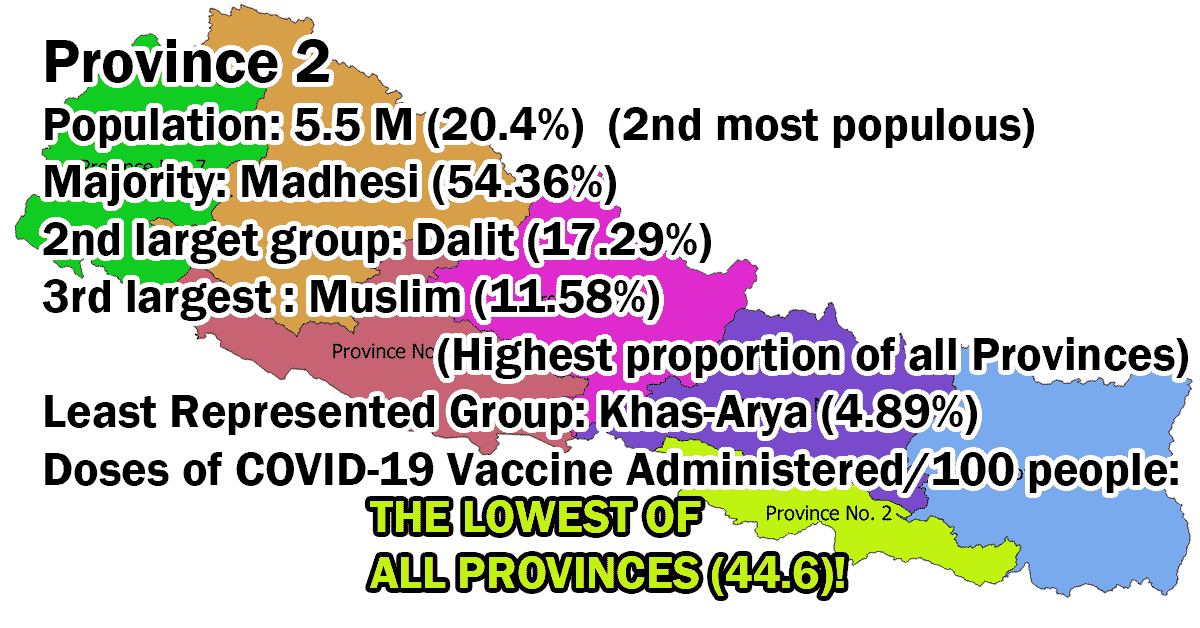
Doses administered per 100 people in Province 2 was the lowest by July 2 (8.1) when data was first made public. It was still the lowest by Aug. 15 (17.2) as well as by Oct. 1 (38.1), and, at 44.6 on Nov. 15, is still the lowest. Let me remind you, the vaccination drive has been going on for almost 10 months!
The question naturally is why has Province 2 been shafted so while other Provinces with much smaller populations and even considerably more remote (such as Karnali) have fared better? There’s probably a number of different reasons but one that I can think of is their composition.
A majority of the population in the Province are the Madheshis (54.6%) (see image), a people indigenous to the Southern Plains where the province lies, against whom other Nepalis are biased and prejudiced. (Compare that to Karnali’s, Province 6.)
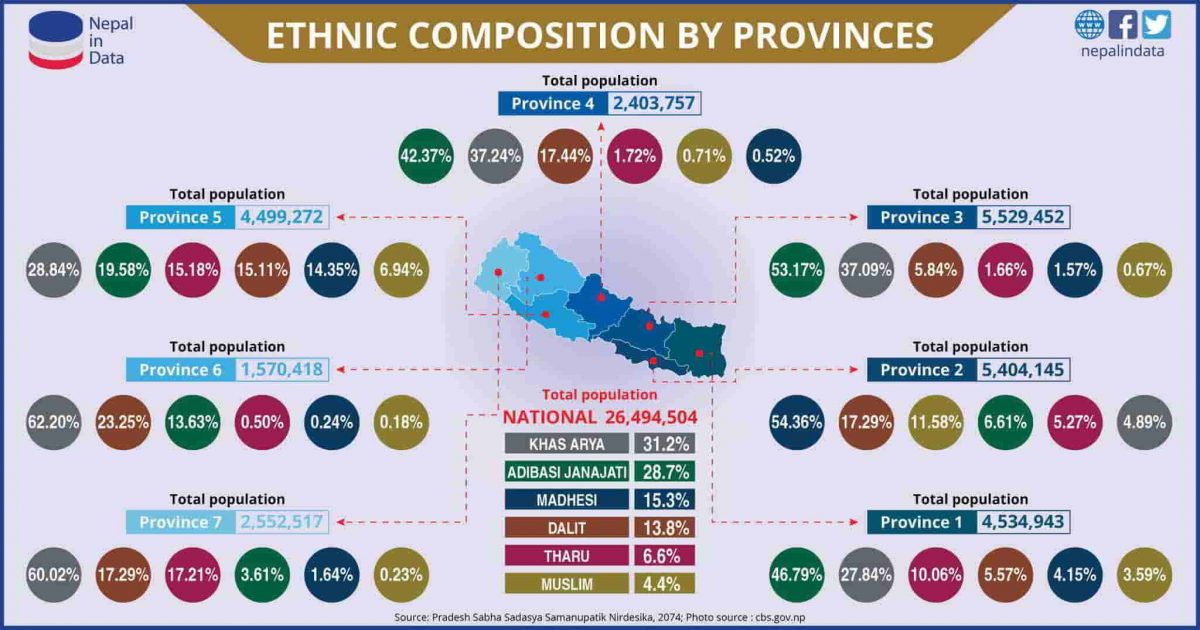
The next most populous group in the Province (at 17.29%) are the Dalits (the “Untouchable” caste, the so-called “lowest caste”), followed by the Muslims. At 11.58%, Province 2 has the highest proportion of Muslims, another group Nepalis view with suspicion.
The Khas-aryas, the Hill so-called high caste Hindus, those disproportionately highly represented in social, economic, and political structures, at both national and in many local levels, at 4.89%, are the LEAST represented in Province 2.
Given that the Madhesis, Dalits, and Muslims are some of the most marginalized groups and therefore some of weakest and vulnerable in this country and their proportion is so so much higher than that of the Khas-aryas, I am NOT at all surprised by what these limited data indicate about Province 2 and vaccine inequity. Considerably more data would be necessary to bolster and confirm that but MoHP has not publicized vaccination data broken down by social groups. What’s more likely is that they probably have NOT disaggregated the data along those lines IF they have collected, compiled, and stored all that information in the first place.
If, against all odds, they have that information, what are the chances that they will make them public? Small, very small, I would say. Why? Simple: because of what they might reveal, what I contend they might reveal!
Disaggregated Province 2 vaccine recipient data by social group will likely look very very lopsided — with disproportionately high percentage of Khas-arya recipients and disproportionately low percentage of Madhesi recipients and disproportionately low, or even insignificant, percentages of Dalits and Muslim recipients.
What is very concerning is that, I am sure the very low rate of vaccination among the almost 5.5 million strong population of Province 2 must have had — and continue to have — an effect on their fatality rates just as other factors, such as medical resources (hospitals, medical personnel, COVID-19 care centers, ICU beds, ventilators etc.), PCR test centers, testing rates etc., must have had and continue to. An analysis of all that, however, will have to be the subjects of follow-up blog posts.
What do you think?
(If you are interested in how Nepalis are biased and prejudiced against fellow Nepalis indigenous to the Southern Plains, click here, here, here, here, and here.)
Feb. 16, 2022 Update
How have things progressed since the blog was published? Not much differently. See for yourself.
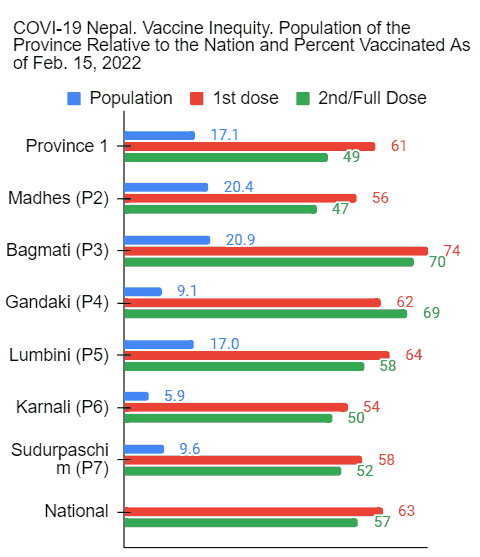
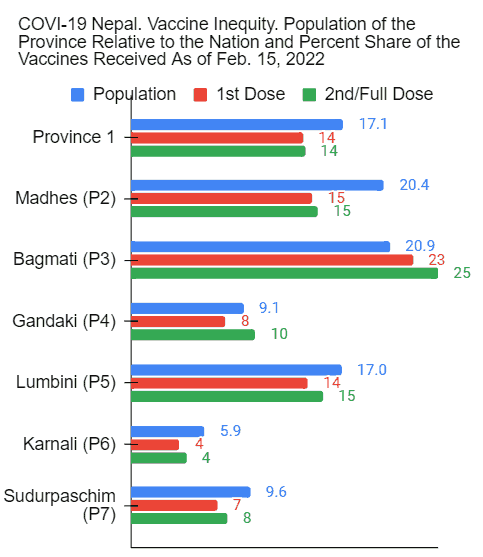
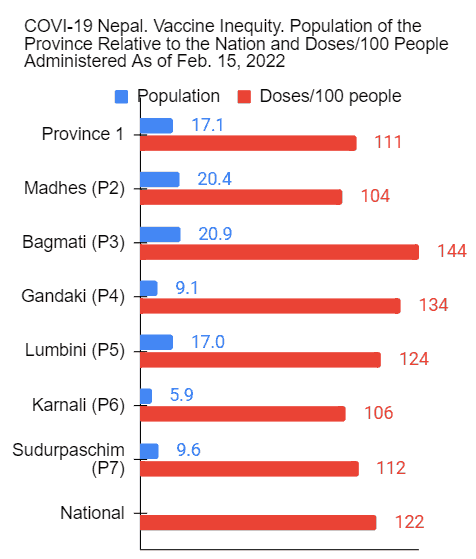
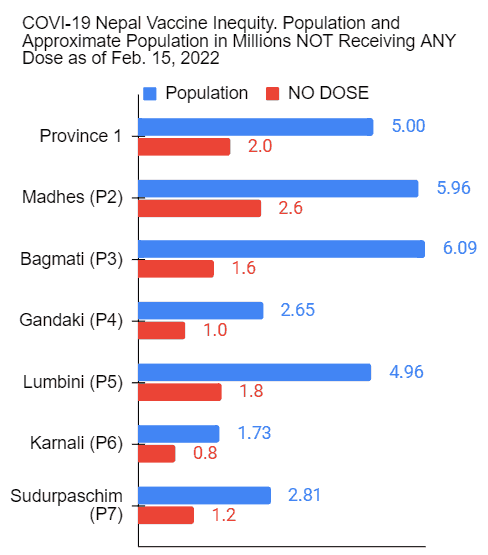
Here’s one confirmation for my contention that the reason for Madhes Province, Provine 2, being shafted is their demographics. The Kathmandu Post reports,
“The total population of the [Rautahat] district [in Province 2] is 586,000, out of which 45 percent is vaccinated. Most of the unvaccinated people are from the Dalit community,” said Suresh Yadav, chief of Gaur Health Office.
There is NO reason to believe that the Dalit communities in other districts in the Province fare better than those in Rautahat.
