Yes, a confusing title that! But then these are confusing times…these unprecedented times of the coronavirus pandemic in Nepal. Read on and you’ll understand one reason for the title!
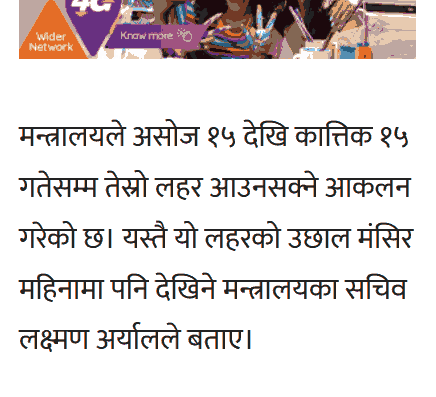
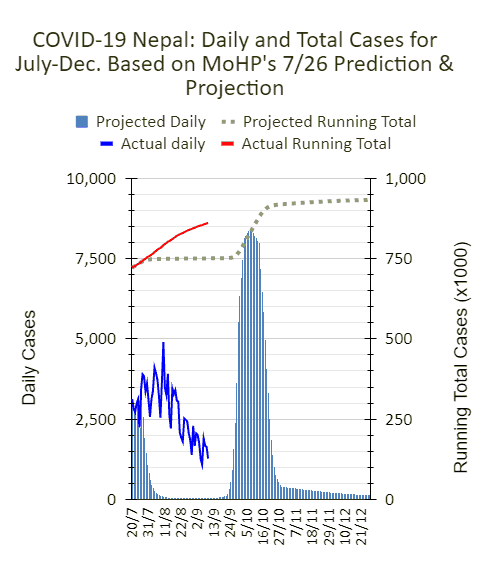
According to this article published on July 26, the Ministry of Health and Population (MoHP) projected the addition of 193K COVID-19 cases in 5 months. The third wave is predicted to hit us in October (see image below).
So, I did something just for the hell of it: I deliberately forced the data to fit the projection and prediction and came up with the following chart.
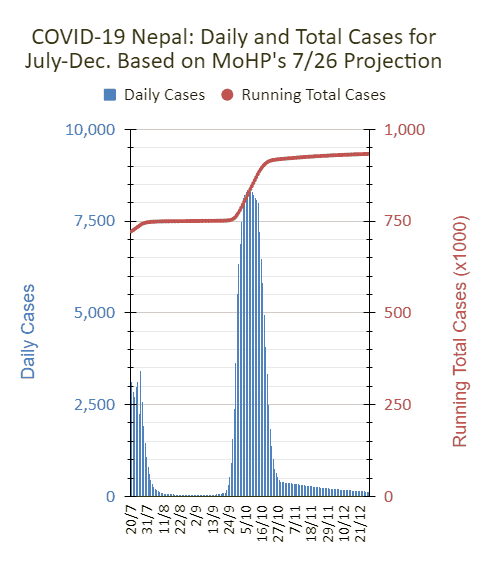
Adding about 193K new cases over 5 months to the total, the caseload came out to 933K by end of December. The other assumption made, as per the MoHP’s prediction, was that the third wave would hit us around October. Yet another assumption I made, which again could be completely off, is that the third wave, at peak, to be as severe as the second wave.
Yes, I am completely aware of the issues with the assumptions. Yes, the third wave could well NOT be anywhere near as severe as the second wave etc. etc. etc.
The MoHP in their prediction, over that five month period, estimated that 39K would need hospitalization (20%) and, out of those almost 10K (5%) would require Intensive Care. Lacking in hospitalization rate, number, and length-of-stay data, it’s hard to make a comparison of the second wave and the predicted severity of the third wave.
HOWEVER, confounding every rational thought or common sense, the Government of Nepal has been easing the prohibitions replacing the countrywide lockdown lifted in the beginning of July.
Just days ago, they decided to allow that which had been closed until then to open and operate in Kathmandu Valley: movie theaters, bars, restaurants, night clubs etc. except for schools. Pretty shocked, I tweeted the following.
Theaters & additional businesses, such as night clubs, to be allowed to operate. Schools still not allowed!#COVID be damned! We are #Nepal! We have our mountain air, turmeric, & guava leaves! 😉😉😉 https://t.co/bBdB0zadfe
— Dorje Gurung, ScD (h.c.) (@Dorje_sDooing) September 3, 2021
The government is also planning up open up schools, even while in their projection, they acknowledge “the increasing level of exposure of children” (see image below).
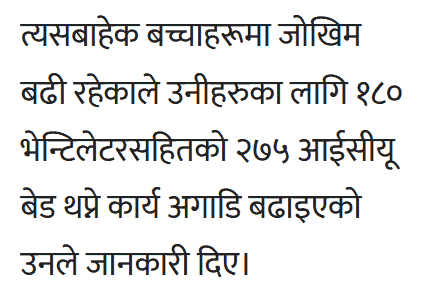
Fearing that the Government might go through with their plans to open up schools, the Federation of Parents Of School Students (!!), apparently, have urged them to NOT do so!
It is true that cases have been dropping! Here’s how tests and cases have progressed countrywide since the second wave peaked in May.
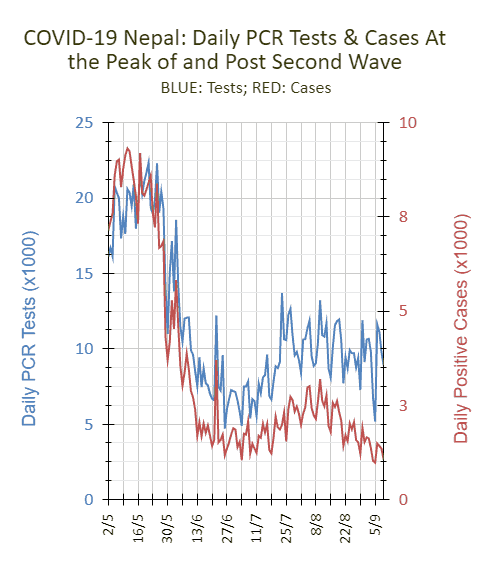
The averages (see chart below) dropped until about the first week of July, then rose until about a little after the first week of August, and, since then, has been trending down. Not surprisingly, however, fluctuations in daily cases more or less mirror fluctuations in daily PCR tests conducted.
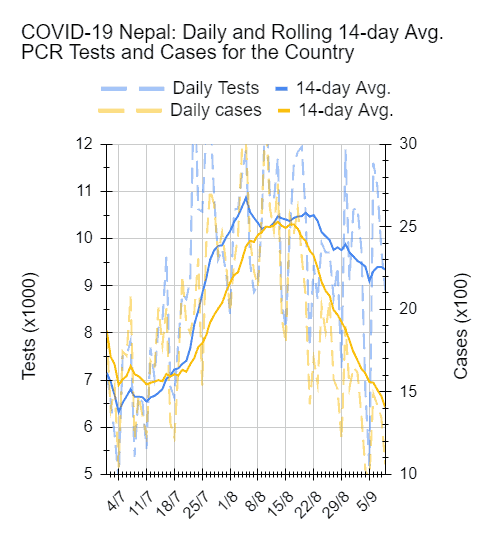
Incidentally, in all the charts below, what you want to concentrate on are the solid curves and their trend.
Having said all that, and before I go on to share and discuss other COVID-19 data for Nepal, I must add a disclaimer here: our data is limited, in some cases severely.
Regardless, a closer look at the numbers for the seven Provinces show pretty much the same trend, a few showing slightly different patterns (such as Province 2, Karnali, and Sudurpaschim). But nothing outrageously different to warrant long commentaries in this blog post.
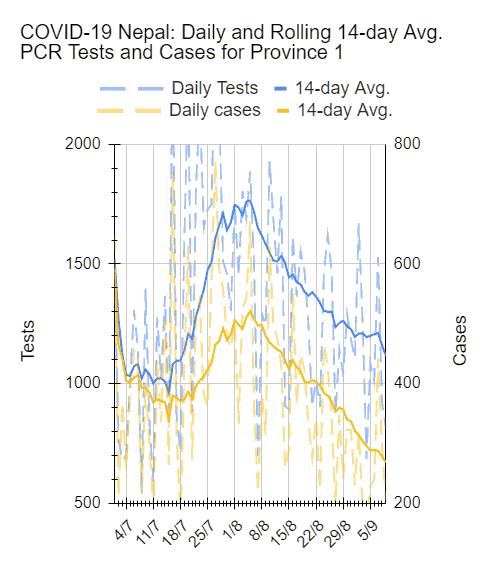
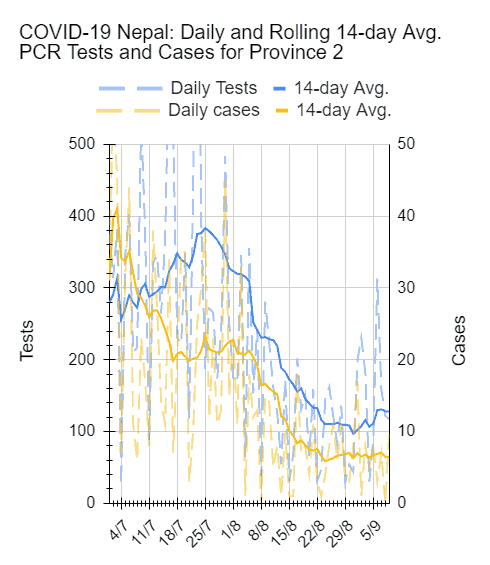
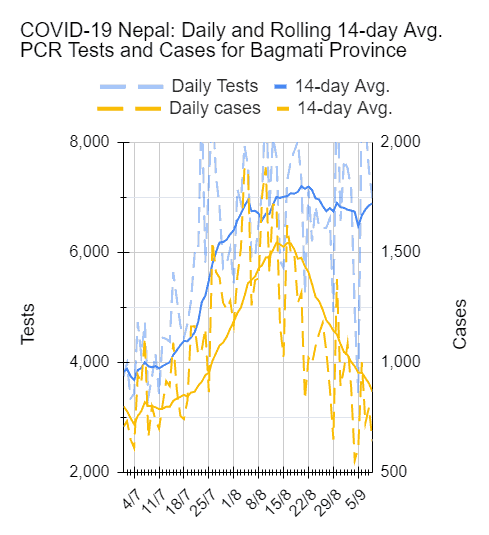
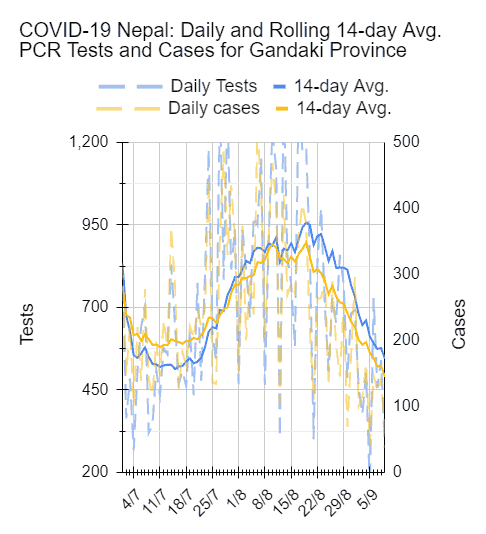
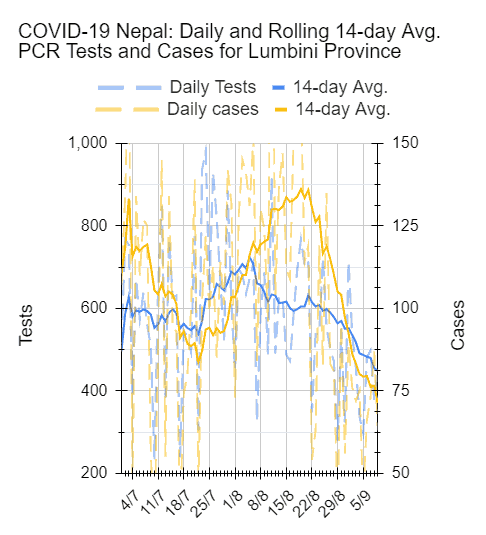
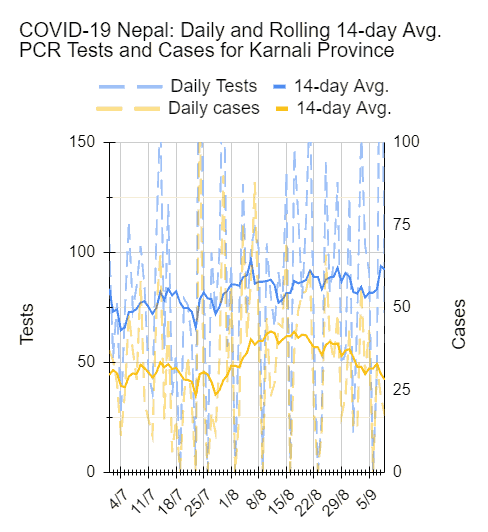
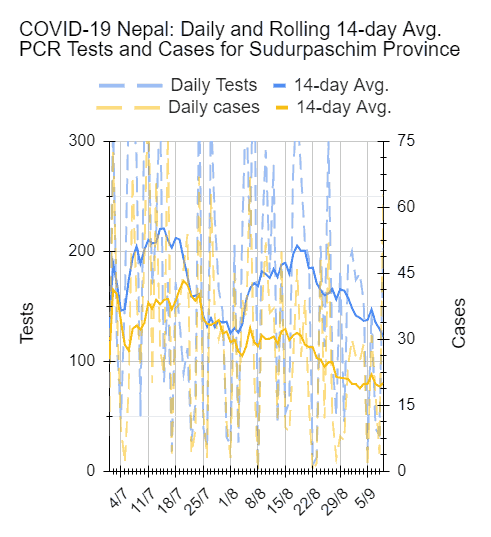
Ok, so, daily cases are trending down.
If the Government of Nepal based their decision on that trend, then they need to look at the charts that follow.
First the positivity rates, which are unacceptably high in every single province.
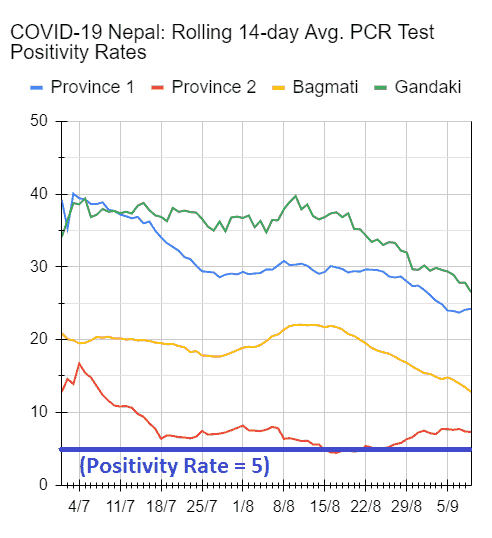
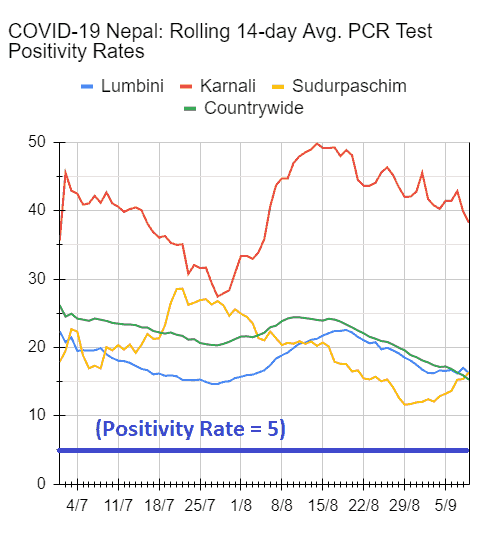
It’s been more than four months that the PCR Positivity Rate has been more than 5.
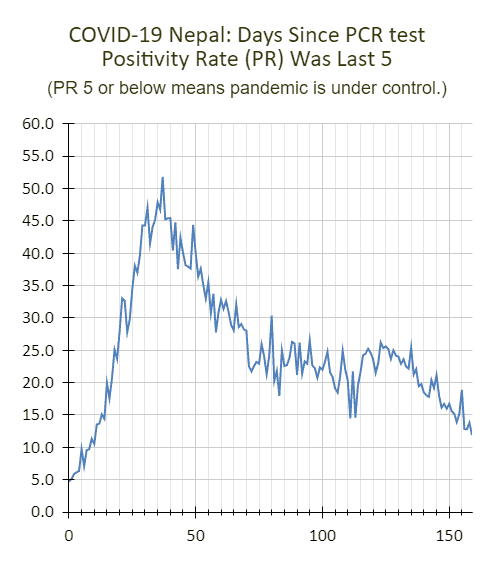
Of course, there could be a number of different reasons for the downward trend in daily cases such as drop in number of tests conducted, who are being tested etc.
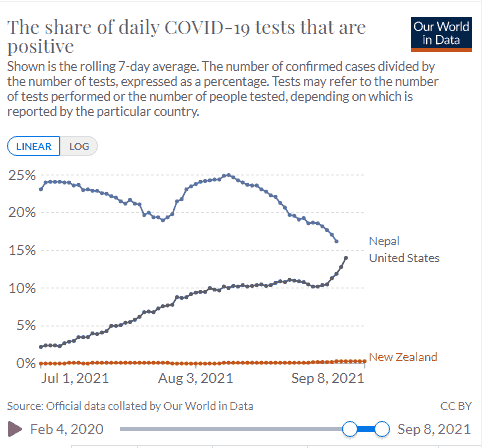
How does our positivity rates compare with other countries? Here’s a comparison with two.
As you can see, our rolling 7-day average positivity rates from July 1 to September 8 have been much higher than New Zealand’s where they have done a very good job of tackling the pandemic, and even the US where, in some parts (like Florida and Texas), the situation is really really dire.
The following two charts show the detection rates (cases per 1000 tests performed). They are all pretty high!
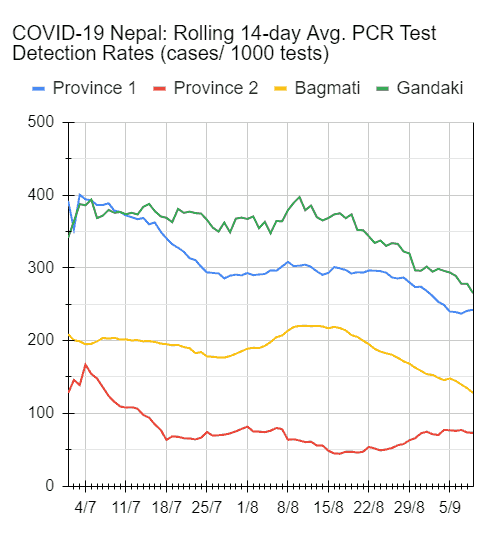
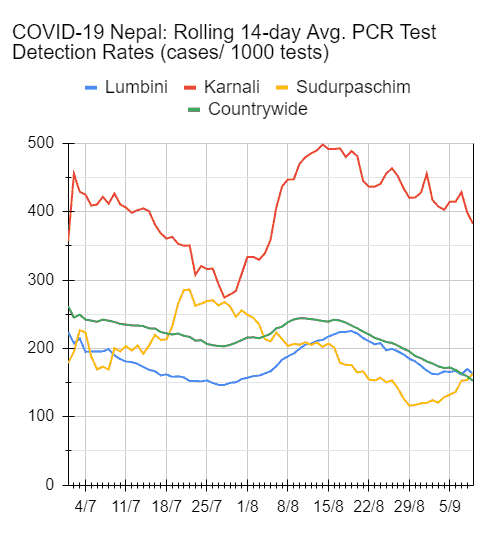
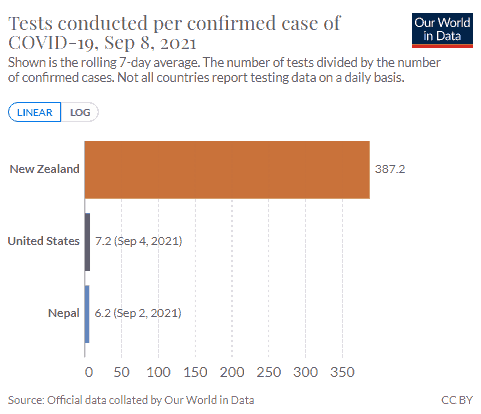
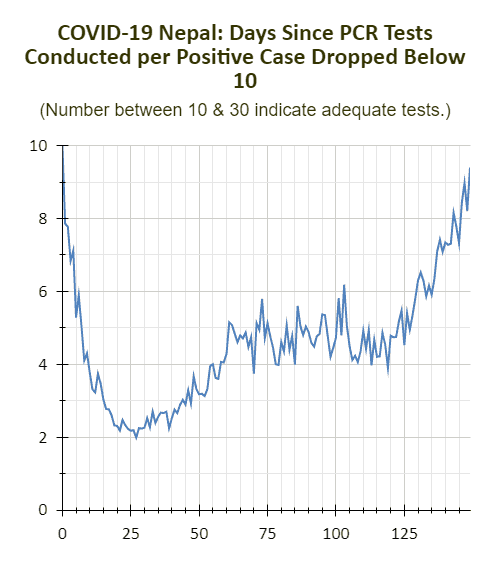
And finally, PCR tests conducted per confirmed case also show that the level of infection appear to be unacceptably high.
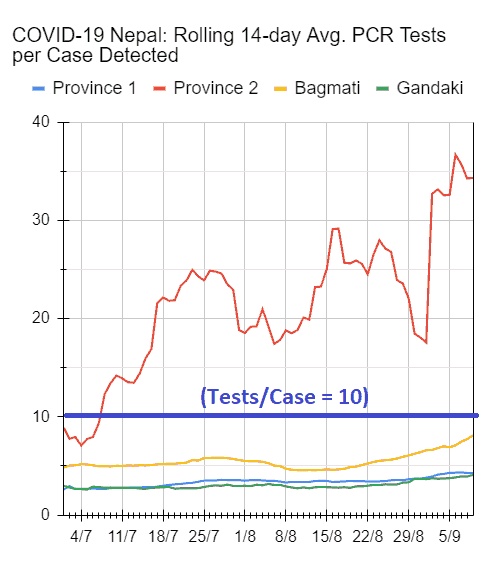
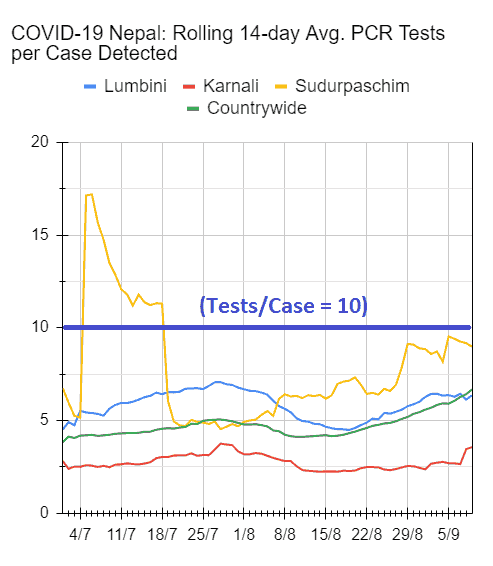
Tests conducted per confirmed case should be between 10 and 30. But, ours dropped below 10 more than four months ago and have remained there ever since. Sure, it’s been trending up!
And how does it compare to the New Zealand and the US? See below.
In spite of all that, why has the Government of Nepal gone ahead and opened pretty much everything up and is planning to open even the schools? Surely they are NOT doing so to ensure their their prediction come out to be true this time around? They couldn’t really have through their action this deeply or surely they are not this twisted!
I mean, except for one single projection the April 13, 2021 one (see image below), every single other projection of theirs did NOT come true!
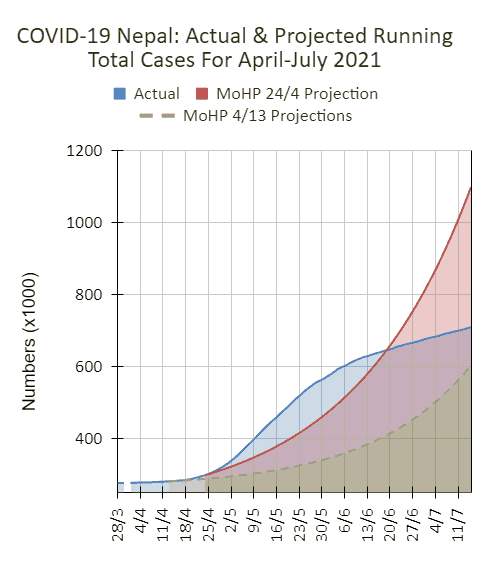
So then, since the Ministry has a pretty bad record with their projections and predictions, are we expected to NOT have confidence in it this time and expected to ignore it, to go about our lives as they want us to with all the relaxations to the prohibitions?
You know what I mean? Who and what does one believe? Does one NOT believe the Ministry? Does one not believe the data? But then again, given the limitations of our data, can one even trust them…or anyone?

