Let me start by reiterating the conclusion: what the charts expose is the legacy of the long history of Brahmanical patriarchy. For the longest time, laws were HIGHLY discriminatory. Other systems and institutions were and still are discriminatory. Both caste-based and gender-based discriminatory practices are still rampant both at the state level and down at the communal and individual level.
The discriminatory laws, systems, and widely held institutional and personal beliefs and practices afforded — for generations — structural privilege and disproportionately higher levels of social capital to the hill so-called high caste Hindus because of their caste, and the Newars for their indigeneity to Kathmandu Valley. One of the many consequences of that? Disproportionately higher level and ease of access to resources and opportunities, such as education.
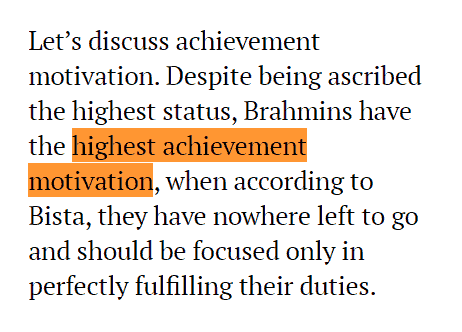
But of course, to the uninitiated — or to those not sufficiently versed in the matters and concepts of Brahmanism (Bahunbaad in Nepali), patriarchy, and structural privilege — structural inequality, structural inequity, and the social and political history of the country of Nepal, that conclusion of mine is likely to appear as just my “bias”! Their logic, something I have heard again and again, is that, because I haven’t accomplished as much (or have the ability to?), I therefore (must) have an axe to grind, a reason to complain! After all, “The hill so-called high castes and Newars are just so much more motivated and hard-working than the rest and therefore more educated.” Sewa Bhattarai spells that out in Book Review: Fatalism and Development by Dor Bahadur Bista. When it comes to the Brahmins, she says they have the “highest achievement motivation.”
Be that as it may, but to make another obvious statement, this stark discrepancy in the identities and particulars of applications to fourteen different positions at an NGO is but just one of many many sorts of places you can see the devastating legacy of our casteist history…if you are willing to look just a little closely.
To begin with, here’s the caste system based on the 1854 Muluki Ain, the “Law of the Land” for the country of Nepal until 1963.
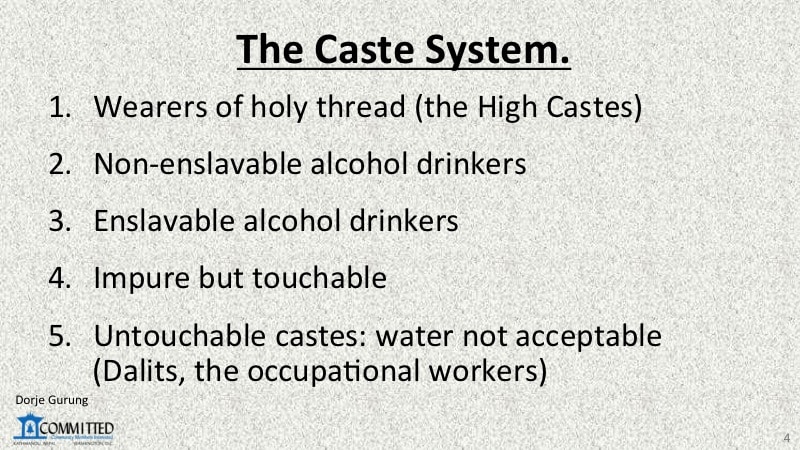
The hill so-called High Castes are the Bahun/Brahmins and Chhetris, also referred to as the Khas-aryas.
Let me interject a disclaimer: I am FULLY aware of the fact that the data has many inherent limitations. For one, these applicants were likely all living and working in Kathmandu Valley. So, what they show should NOT and CANNOT be used — or viewed — as representative of the country. The relative numbers associated with the variables vis-à-vis the social groups in the country or in another part of the country could be better or even worse than this.
HOWEVER, the broad general conclusions I draw based on the data about the structural issues inherent in Nepal and Nepali society, I am confident, are representative of the country.
Anyway, for your information, first I’ll share the data about all the 419 applications, then data about the female applications, and round that off by data about the males.
Applications instead of applicants because some individuals applied for two or more positions. (Some of the chart titles say “Applicants” as opposed to “Applications” for their own reasons.)
Here are some of the observations and conclusions:
- the highest number of applications were received for the positions requiring the least experience and lowest qualification
- a little more than half the applications were for those two positions
- the most representative age group was that between 19 and 29,
- male applications outnumber females by 2 to 1
- the hill so-called high caste Hindus (Bahuns and Chettris) are most abundant followed by Newars
- disproportionately high percentage of hill so-called high caste Hindus and Newars hold advanced degrees
The Applications
Here is a breakdown of the applications by the positions they applied for.
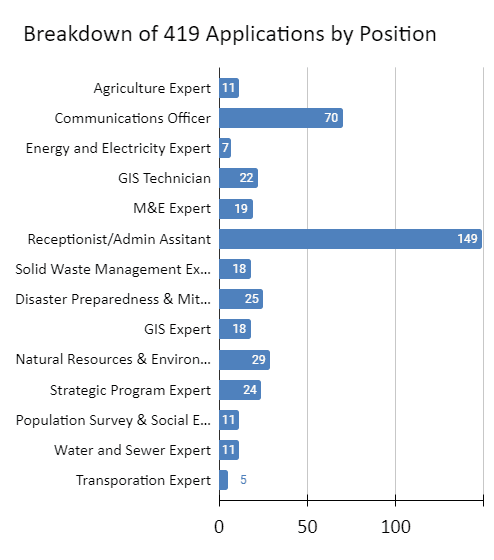
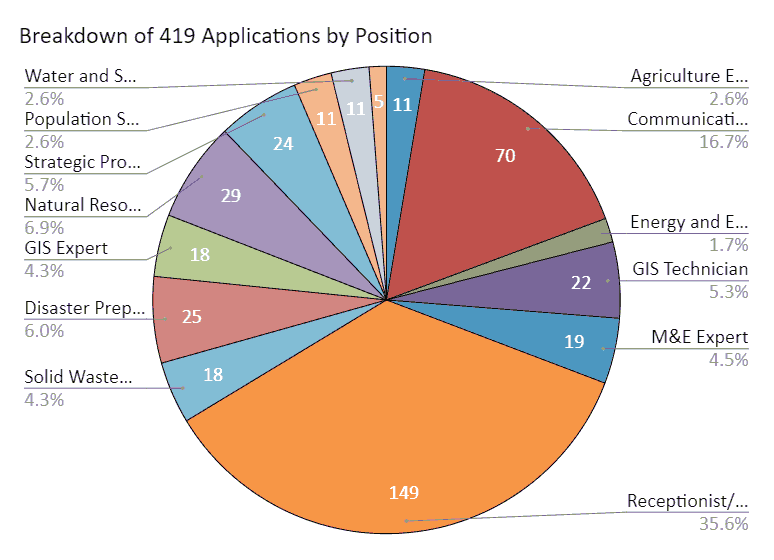
As you can see, the highest number of applications were, not surprisingly, for the two lowest positions: 35.6% for Receptionist/Admin Assistant and 16.7% for Communications Officer. I’ll come back to this later.
Here’s a breakdown of all the applications by gender.
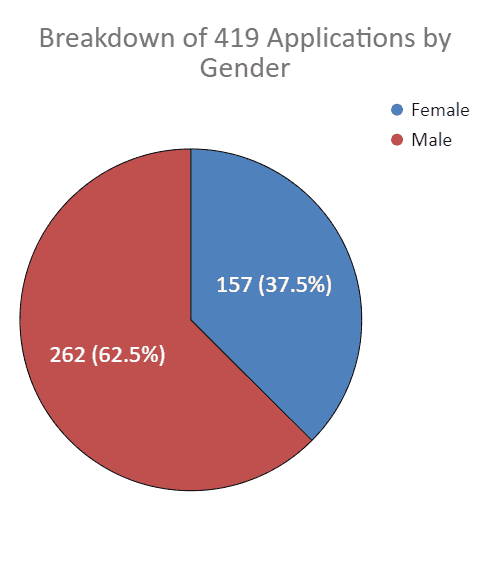
Of course, not surprising that males represent almost twice the females. We are, after all, a highly patriarchal society where they are given considerable more opportunities and freedom.
The following pie chart breaks down the applications by age.
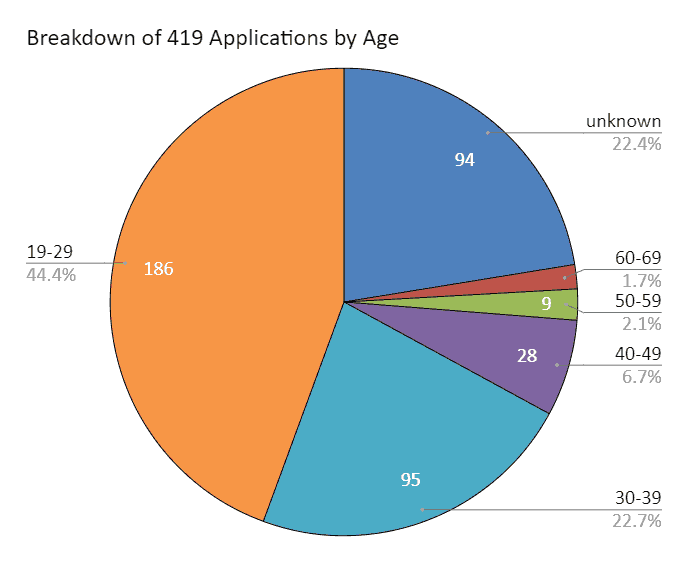
That almost 50% of the applications represented those less than thirty years of age has an interesting explanation — a disproportionately high percentage of them were female, as you shall see later.
Next, a breakdown by a combination of social group (caste) and ethnicity.
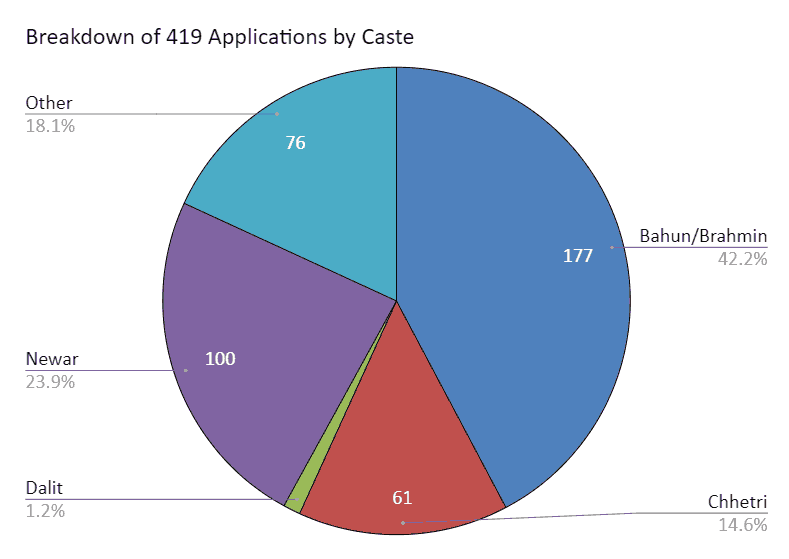
The Newars, incidentally, as an ethnic group belong to caste number 2, “non-enslaveable alcohol drinkers” which, not surprisingly and understandably, is a point of contention for some of them. (This blog post is NOT the place to go into the details of that though.) “Other” are those belonging to castes 2, 3, and 4. I should mention that the indigenous population of Kathmandu Valley, where pretty much all the applications must have come from, are the Newars, though they might NOT be a majority anymore.
Notice, over 50% of the applications came from the hill so-called high caste Hindus, a population that makes up only about 30% of the population of the country (see below).
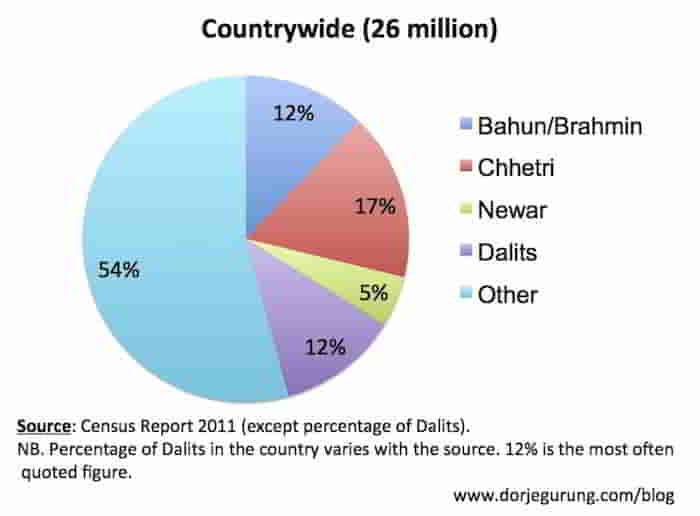
Why are the numbers so skewed? Why is the breakdown of the applications along social-group lines so completely off from that of the make-up of the population? Why are the hill so-called high caste Hindus representing about 30% and Newars representing only about 5% of the population so disproportionately highly represented?
The reason for disproportionately high representation of the hill so-called high caste Hindus is structural issues the country suffers from — a legacy of casteist history of the country. As for the Newars, one reason is their nativity to Kathmandu Valley.
Systems and structures pretty much entirely founded on highly discriminatory social system, the caste system, have elevated, supported, and advanced the hill so-called high caste Hindus throughout history. One of the consequence of that has been their disproportionate access to education, for example, which is indeed revealed by a breakdown of the applications by caste and qualification as you shall see.
But first a pie chart breaking down the applications by qualifications.
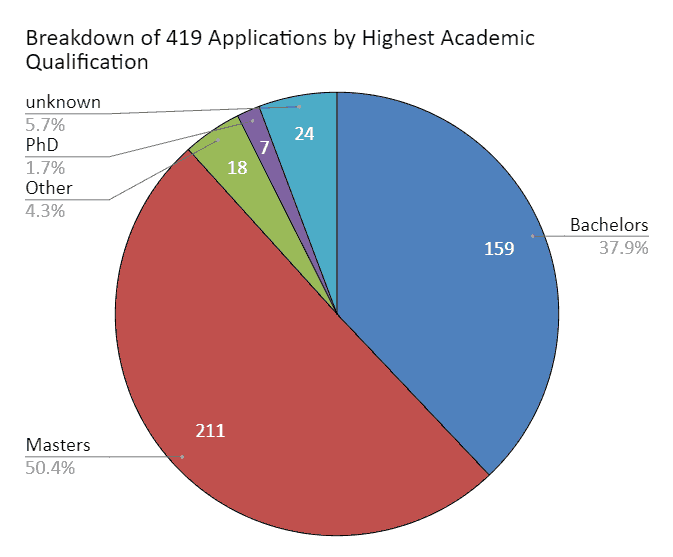
Of course, to state the obvious, that does NOT mean that we in the country have a high proportion of population holding advanced degrees. The breakdown of the applications show what they do because most of the positions required advanced degrees. Breakdown of the applications into social groups and qualifications reveals more, considerably more.
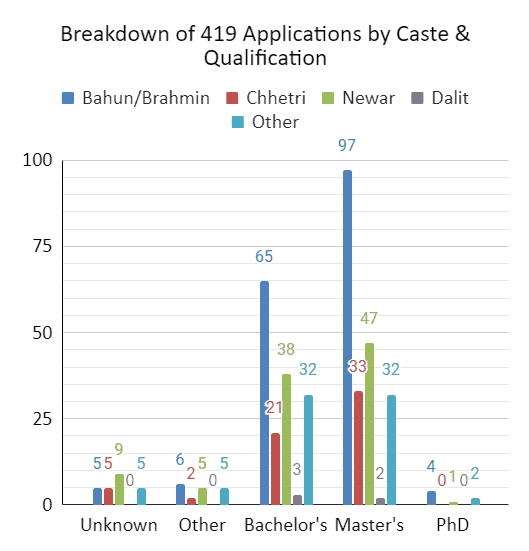
First, here are the raw numbers.
Here are the relative numbers.
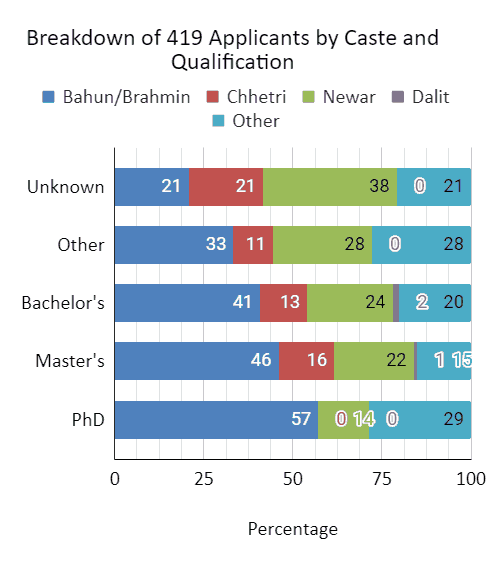
Disproportionately high percentage of Bahuns, the so-called highest caste, have advanced degrees — Masters and PhDs — followed by the Newars.
How does that reveal the structural issues inherent in Nepali society? Education of the the population of the country has NEVER been a serious priority of the State of Nepal. As a matter of fact, the feudal Rana oligarchs, during their 104 years of reign ending in 1954, made sure that hardly anyone apart from them had access to education. They established the first school in the country, Durbar School in Kathmandu, for themselves, for example. The autocratic Shah rulers who followed them weren’t much better either! They did start a campaign to educate the population but it was half-hearted at best.
See below for the level of education of the population. The quality of education throughout has also been abysmally and embarrassingly poor!
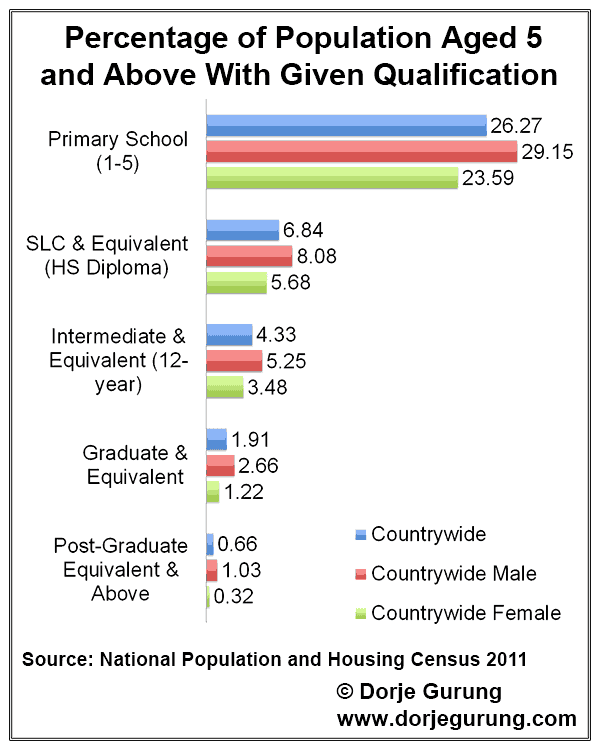
Not surprisingly, among those very very small percentage of the very highly educated, those who have had access to tertiary education, are those who are very highly placed — the structurally privileged, the hill so-called high caste Hindus, and the Newars residing in Kathmandu Valley.
In other words, that such a disproportionately high percentage of advanced degrees are held by the so-called highest caste reaffirms how the systems and structures in the entire casteist history of the country of Nepal favored the hill so-called high caste Hindus — men to be more specific, as you shall see later.
The country has suffered from and continue to suffer from both individual as well as systemic and institutional discrimination which have led to the flagrant disparity in, for example, the education level of different social groups among other things. (Ancestral wealth is another.)
The data also indirectly expose a glaring feature of Nepal — the inequality and inequity inherent in social, economic, and political structures, directly or indirectly based, as they are, on the deeply corrupt monstrosity that is the caste system.
Those who are represented disproportionately highly in all those structures are the hill so-called high caste Hindu men, just as they are in these applications, as you shall also see.
Female Applications
Only 157 (37.5%) of the 419 applications were from females. Here are some of the general conclusions:
- the highest percentage of the applications and a majority at that (63%, almost 2 in 3) are for the job requiring the least qualification and experience
- more than 1 in 3 (35%) of those with a master’s degree applied for the lowest positions
- 9 in 10 (90%) were between the ages of 19 and 29, hinting that the level of professional women in the country 30 and over must be disproportionately and likely even abysmally low
- those with advanced degrees, not surprisingly, are disproportionately high percentage of the hill so-called high caste Hindus and Newars
- about 4 in 5 (80%) of the applications came from BCN (Bahun-Chhetri-Newar) trio of social groups who make up about 35% of the population
Here’s their breakdown by position.
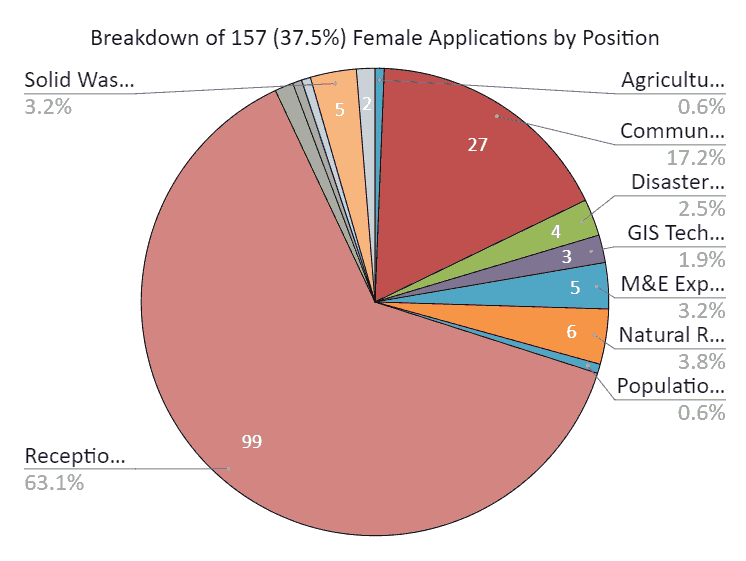
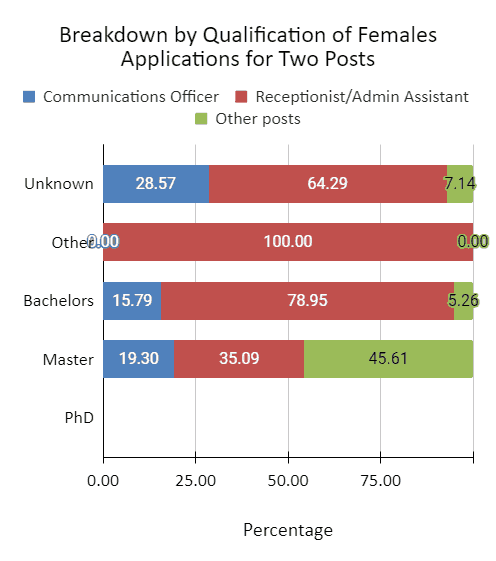
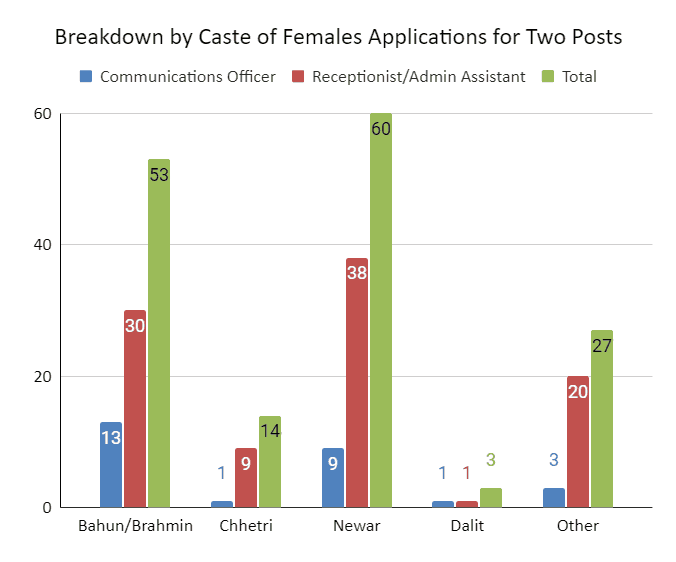
Of the 149 applications for the position of Receptionist/Admin Assistant, 99 were female — a whopping 63.1% of them! Of the 70 applications for the position of the Communications Officer, 27 were female. In other words, 80.3% of all females applications were the two junior-most positions! That, as far as I am concerned, is a result of our regressive views of, attitude towards, and treatment of our females.
The following two charts reinforce that conclusion.
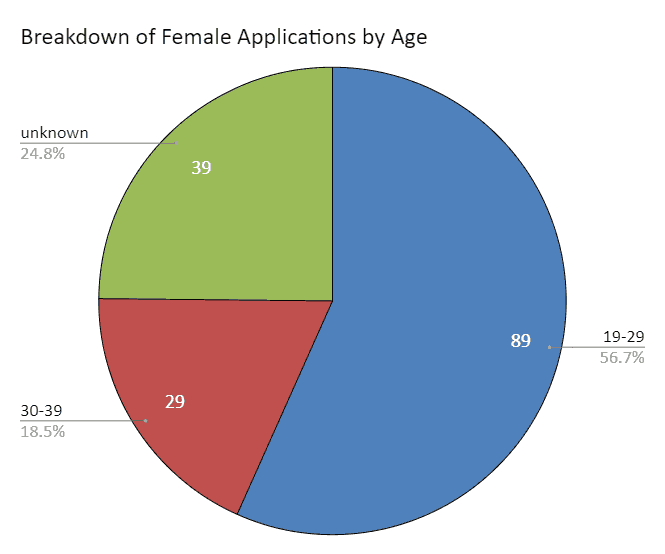
In other words, a majority of the female applicants (56.7%) are young adults!
More than a third (36.3%) had a masters degree!
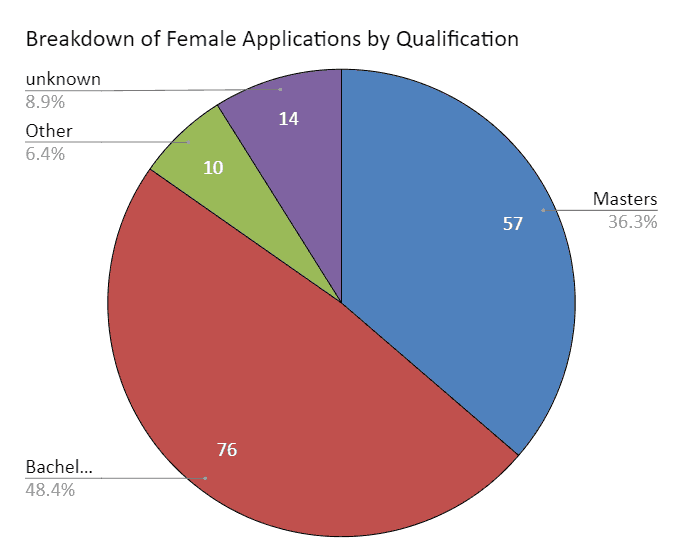
And yet, as you already know, a majority of them applied for the lowest positions, about which I’ll have more to say later.
The caste distribution, again, as with the overall distribution, is skewed towards the hill so-called high caste Hindus (42.7%), followed by Newars (38.2%).
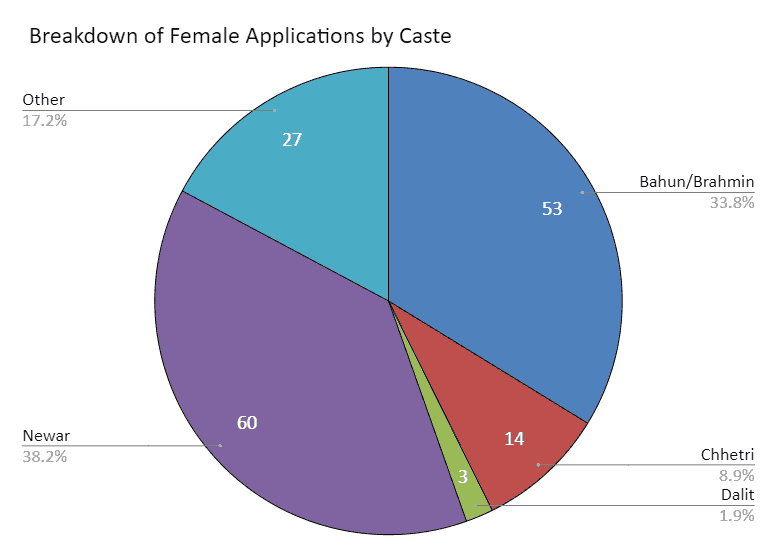
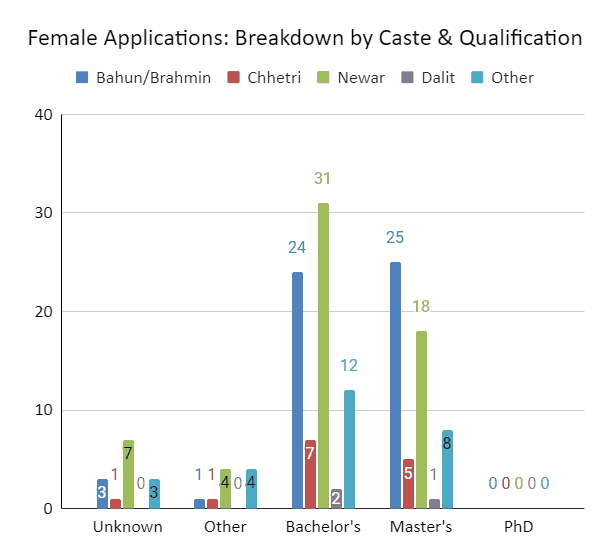
But of course, there must also be a relationship between caste and qualification! Here are the raw numbers.
Here are the percentages.
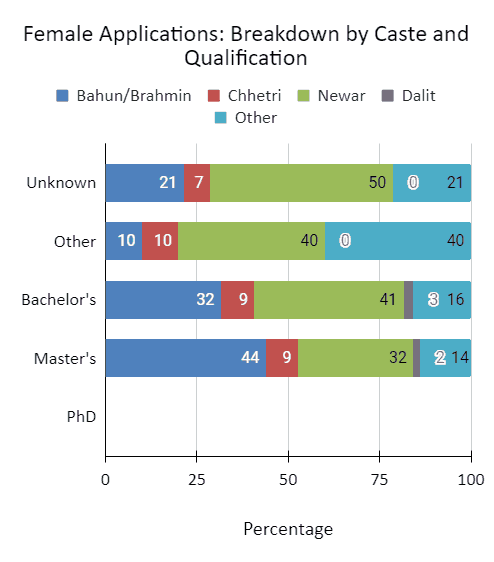
The BCN (Bahun-Chhetri-Newar) trio are represented the most in both the pools of those holding Bachelors (82%) and Masters (85%) degrees. That is consistent with the fact that BCN trio, along with the Madhesh (Souther Plains) so-called high castes, are the groups with the highest scores in the Human Development Index.
Now, let’s look at the applications to the two junior-most positions….
Here’s the breakdown of the female applications by qualification — raw numbers followed by percentages.
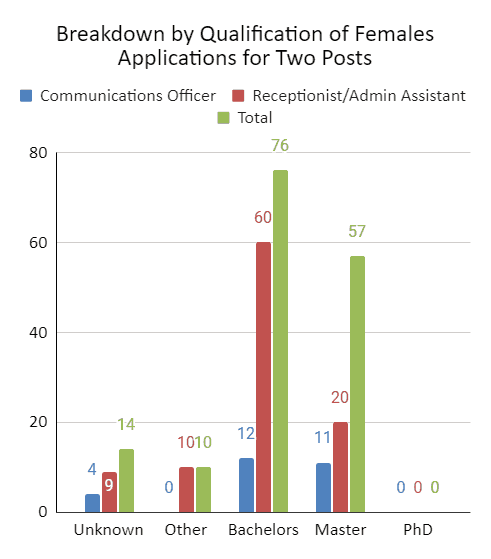
How many of each group applied for them?
What percentage of each group applied for them?
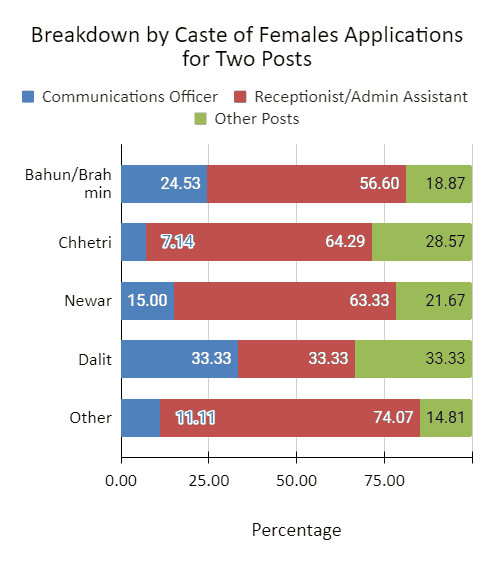
Returning to females with master’s degree applying for the position of a receptionist: I may wrong here but could that be a reflection of
- poor quality of the degree?
- their skill level?
- their self-confidence?
- family and societal expectation?
- some combination of those? or
- something else — or some other things — entirely?
Whatever the reason — or reasons — that females with master’s degree are applying for the position of a receptionist at an NGO (non-profit organization) reflects poorly on our education system and/or our society, as far as I am concerned.
Male Applications
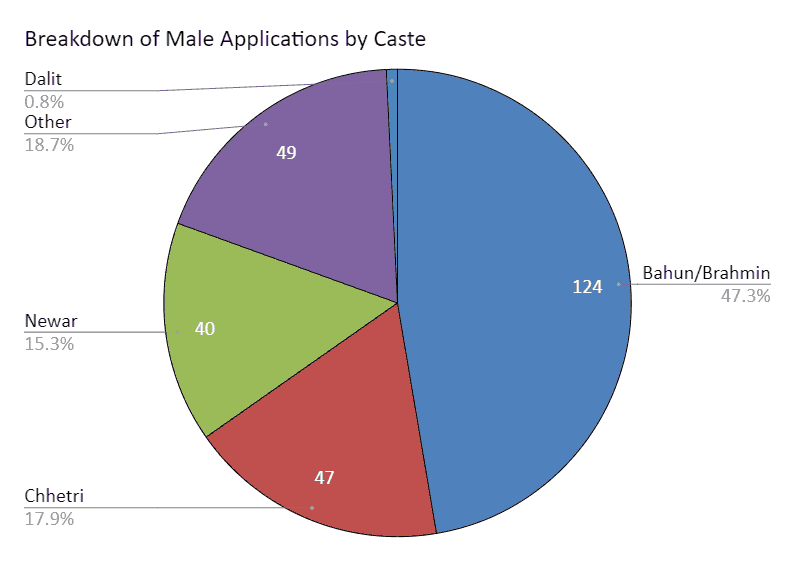
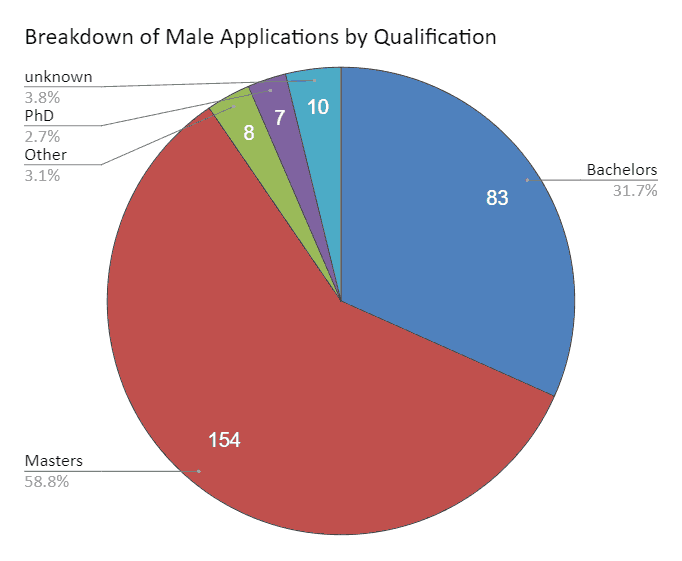
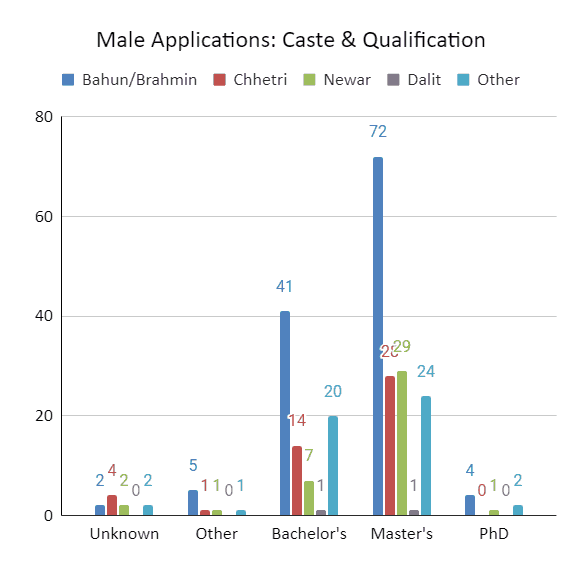
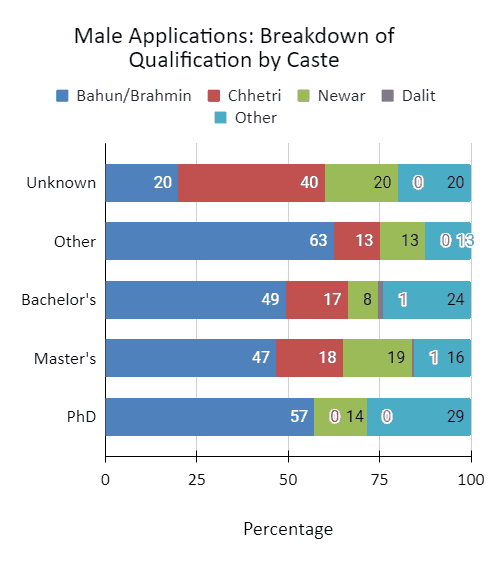
Finally to male applications, which I won’t discuss much because the charts speak for themselves. Yes, they contrast so outrageously with the female applications that commentaries would be superfluous.
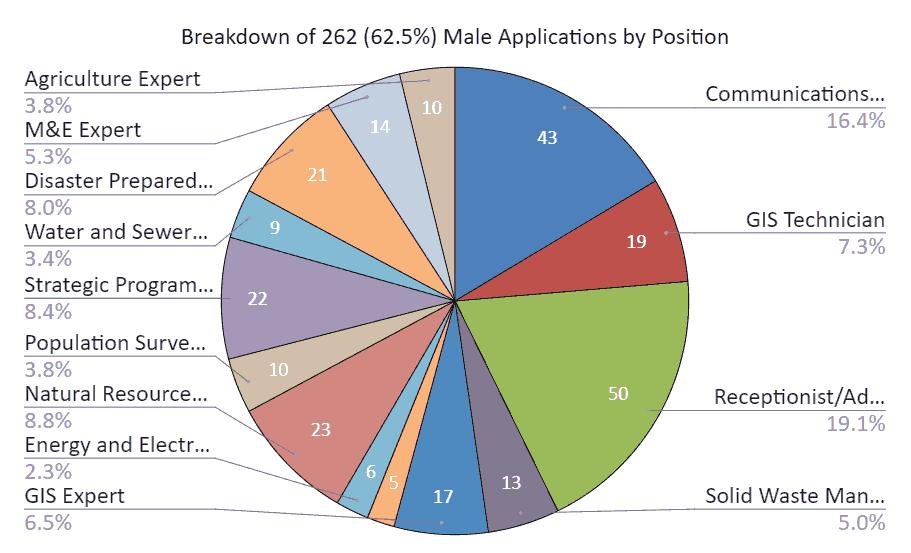
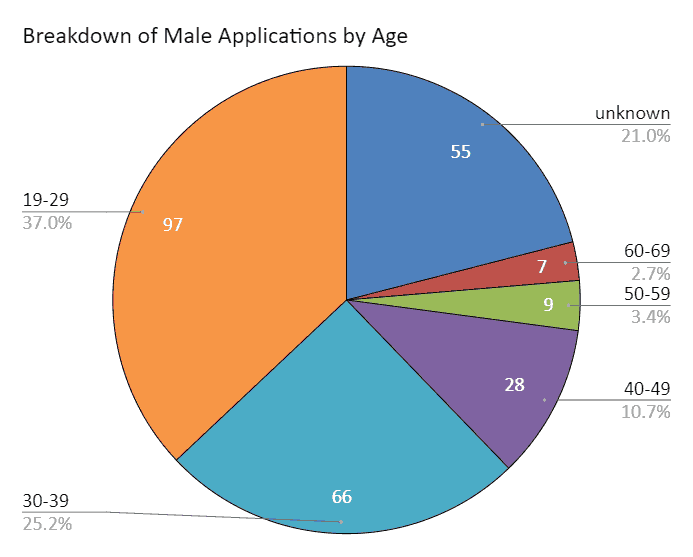
There you go!
What do you think?
(This is a second blog on the subject. You can find the first one here. It includes fewer charts. Some of the above charts also appear in this twitter thread.)
