Noticing a strange pattern in the active COVID-19 cases in Nepal I made the following tweet on May 23.
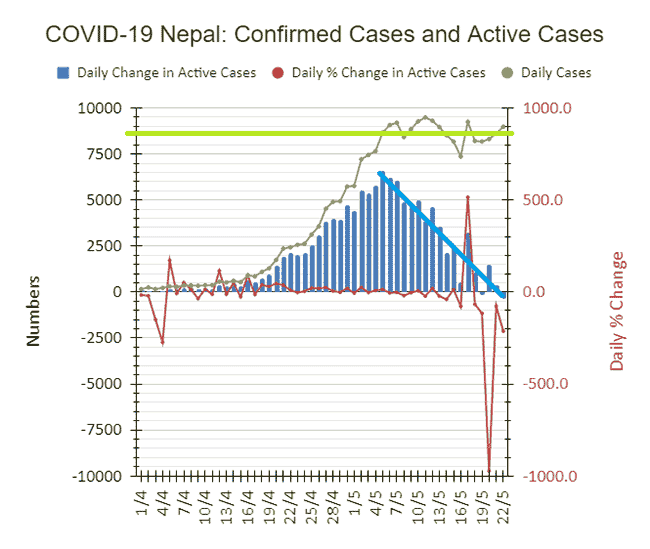
I started by saying, “From May 5, # of #ActiveCases added to total has been LOW & DROPPING (blue trendline) EVEN while daily cases have been ~8K (green line)!” I rounded it off by asking, “What’s going on? Recovery rate >> than DetectionRate?”
#COVID19 #Nepal Update
— Dorje Gurung, ScD (h.c.) (@Dorje_sDooing) May 23, 2021
As limited as our data is…
Something intriguing:
From May 5, # of #ActiveCases added to total has been LOW & DROPPING (blue trendline) EVEN while daily cases has been ~8K (green line)!
What’s going on? Recovery rate >> than DetectionRate? @Bish_Bhandari pic.twitter.com/fUdwjFulhl
Here’s a reproduction of the chart.

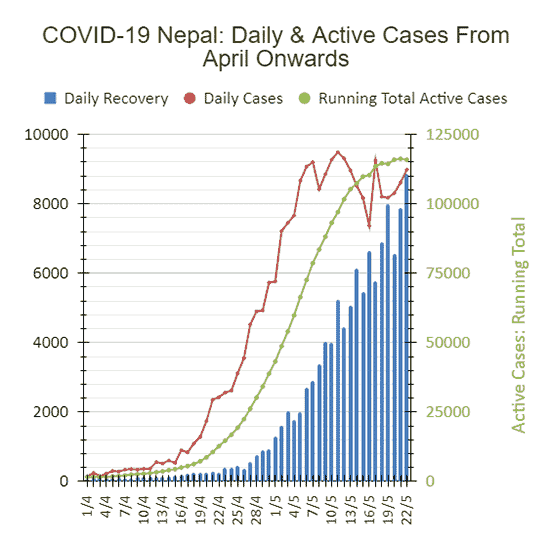
I folowed that tweet up with the following. “Had a look at the daily cases (red), daily recovery numbers (blue), & d running total of active cases (green).”
I also added the following questions: “Daily recovery numbers are catching up to daily cases. How come? Just d sheer number of active cases? Or is something else going on? If something else, what?”
Had a look at the daily cases (red), daily recovery numbers (blue), & d running total of active cases (green).
— Dorje Gurung, ScD (h.c.) (@Dorje_sDooing) May 23, 2021
Daily recovery numbers are catching up to daily cases.
How come? Just d sheer number of active cases? Or is something else going on? If something else, what? #Nepal pic.twitter.com/99wi6X5hlx
Here’s a reproduction of the chart.

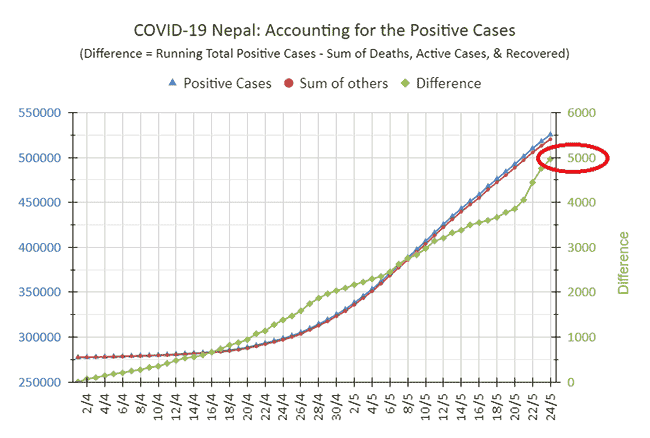
So I went digging! The final conclusion or the result of the dig was that Ministry of Health and Population may have been “disappearing” cases each day starting from the beginning of April. By May 24 about 5K cases had been unaccounted for.
Went digging a bit & discovered that MoHP may have “lost” or “disppeared” at least ~5K positive cases (green circle). Chart is for April-May 2021.
— Dorje Gurung, ScD (h.c.) (@Dorje_sDooing) May 25, 2021
Charts for other months show curious spikes–some likely just errors & others likely “corrections”…+ pic.twitter.com/pNN1p5dRq2
Here’s a reproduction of the chart appearing in the above tweets.

The calcuations and the conclusion are based on the assumption that a confirmed COVID-19 case, following the confirmation, is counted either as an active case (and therefore in isolation) or one that’s recovered, or a fatality. So, the running total of confirmed cases at any given time from when we started tracking them must be equal to the sum of the active cases (cases in isolation at the time), the total number of cases that have recovered until that time, and cases that have become statistics, sadly.
If you are interested, here are the live versions of the important charts above. The following one charts the daily cases, and daily and percent changes in active cases.
The following one charts the running total active cases, daily cofirmed COVID-19 cases, and daily recovered cases.
The following shows the running total cases, sum of the other three (active cases, recovered, and deaths), and the difference between them.
The following one is a reprodution of the above but starting from April 1. As such, you can see better how the diffrence is changing. That is, this one is the one to watch as it will show you how the number for the unaccounted for confirmed COVID-19 cases are changing.
So, while before April, Ministry of Health and Population “corrected” and added adjustments to at least the fatalitiesthey haven’t borthered to do so from April onwards. Or maybe they will come at a later date still.
What do you think?
June 6 Update
Earlier today I had a closer look at the data and discovered that the “unaccounted” cases represent Antigen test positive cases. Compare live chart below and the green curve in the above chart. In other words, strangely and perplexingly enough, those who test positive following Antigen tests are neither counted as Active Cases nor do they recover nor do they die!
June 16 Update
Last Saturday (June 12), I brought this up with Swarup, a journalist with Kantipur with whom I have collaborated on past articles publishsed in the daily. He wrote up an article around it; it was published on Monday, on June 14.
