On April 13, Nepal’s Ministry of Health and Population (MoHP) shared a projection of COVID-19 cases. Accordingly, the total caseload is predicted to hit 600K and the daily cases 11K in the next three months.
I worked out the progress of the daily and running total cases. Here’s what it looks like.
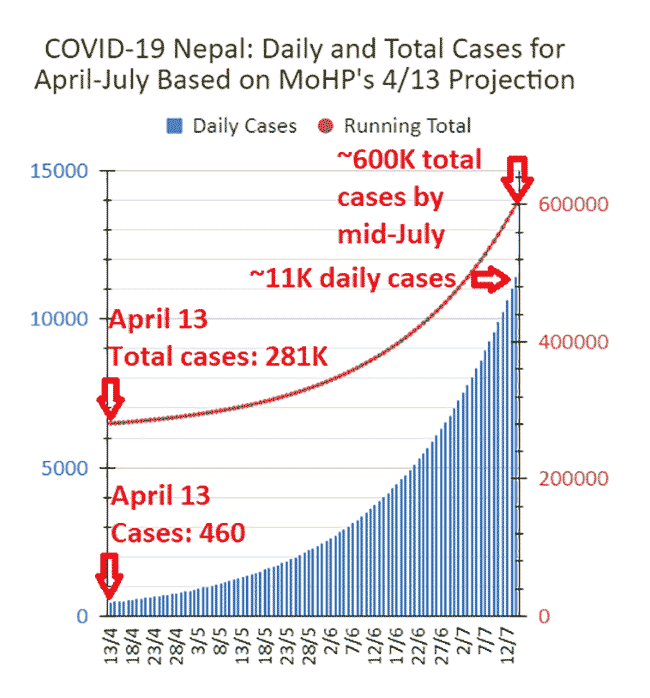
The numbers was arrived at by using the the data for April 13 and MoHP’s projection as well as by assuming the projection would come true exactly three months later (on July 14) following a very uniform growth rate. By a uniform growth rate, I mean growth of the daily cases by a fixed percentage from one day to the next.
The more important question is, how good is the MoHP’s projection and, therefore, how likely is it to come true?
To attempt to find an answer to that question, I went back to MoHP’s past projections.
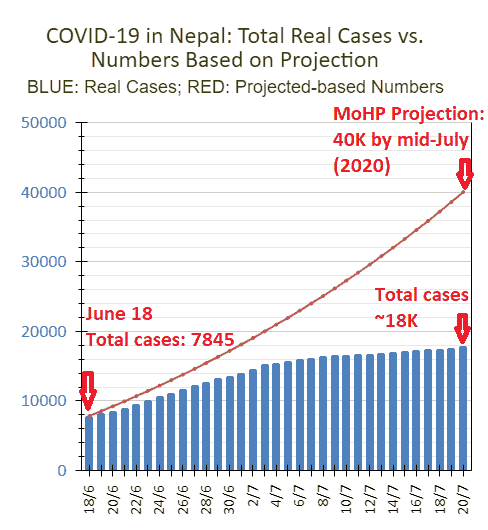
The first time MoHP made a projection was on June 18, 2020. They estimated that by mid-July the total number of cases would hit 40K. On June 18, the total number of cases stood at 7845. Using those numbers and assuming that the projected numbers would be realized on July 20, I worked out the numbers.
The chart below shows the running total projected numbers (red curve) and the real numbers (blue histogram).
The chart below shows the projected daily numbers (red curve) and the actual daily numbers (blue histograms).
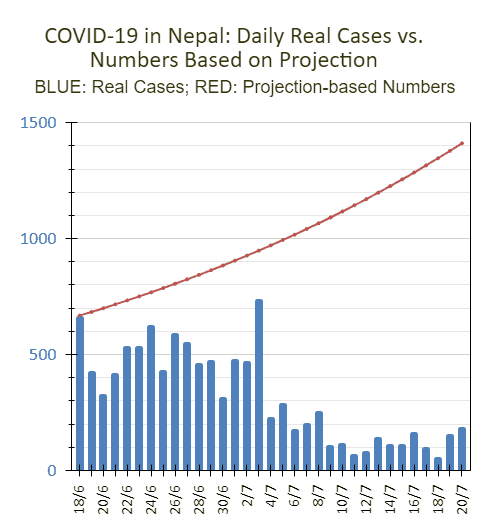
As you can see, MoHP’s projection was completely off! Forget the growth rate of the actual daily cases matching that of the predicted rate. The real growth rate actually fell over that period! So the total cases in July, LUCKILY, fell far short of the predicted numbers!
I would like to add a cautionary note here before I continue. I am NOT implying that the COVID-19 cases detected and reported in that period were indeed a true reflection of the prevalence of the infection in the population. The reason is simple: COVID-19 testing in Nepal is severely limited both in numbers and method. I really don’t have any knowledge of the infection rates. I don’t think anyone does.
Moving on to the second projection, which came on November 21, 2020. They estimated that the caseload would rise by around 148K in four months. Again, given that the caseload on November 21 was 219K, the total in four months, would be 367K. Assuming that number would be reached exactly four months later, on March 21, I worked out the numbers…except I discovered something really strange!
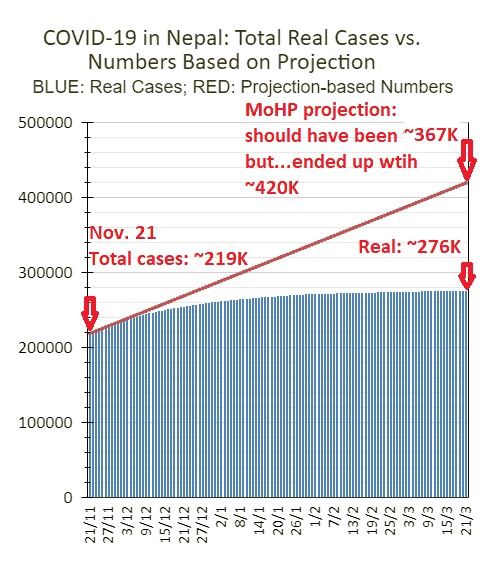
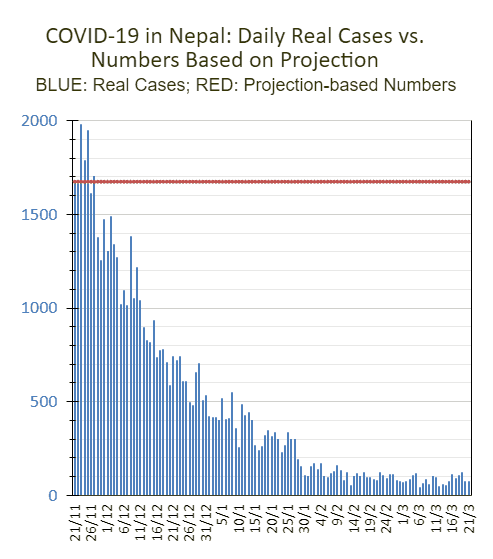
In other words, even assuming zero growth rate, I couldn’t get my final number for March 21 to match MoHP’s. I ended up with a total caseload of 420K, 53K higher. MoHP appeared to have made the projection based on NEGATIVE growth rates during the period (see chart below)!
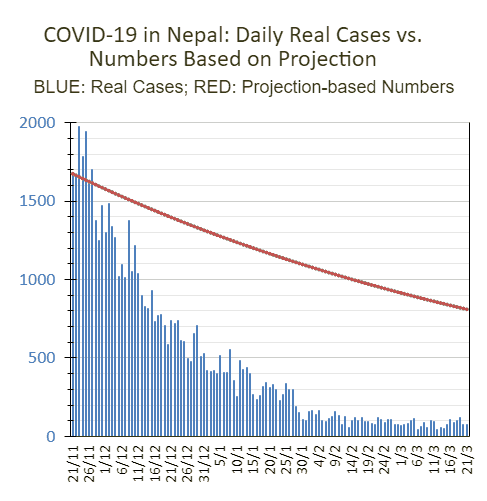
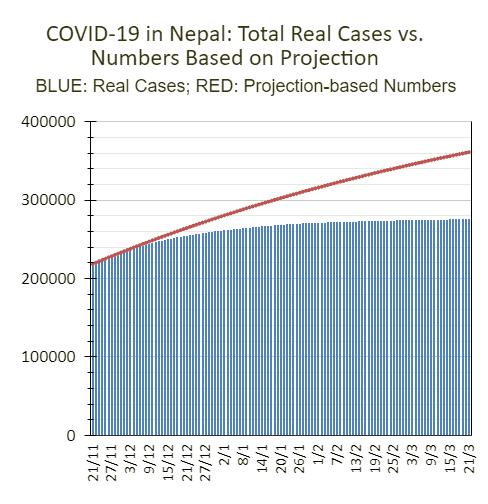
What the projection did get right FORTUNATLY was the negative growth rate. As a matter of fact, it went into negative territory not long after MoHP made their projection. And luckily for us, it just kept falling — or APPEAR to have kept falling — resulting in a SIGNIFICANTLY lower March 21 caseload than projected!
Given the projections turned out to be so off (except for the negative growth rate!), the next obvious question is what were the basis for them?
I am NOT sure.
I suspect the June 2020 projection was based on the secret study commissioned by the Government of Nepal. The study was completed in May that year but wasn’t made public until much later. As for the November projection…who knows!
And finally, to return to the most important question: What are the chances of the current projection coming true? What is the reliability of the current projection? If we go by the past two projections, low! However, my short answer would have to be, “No clue.”
BUT I hope that they have f*cked up again as they have always done…because, if they haven’t, then we are f*cked!
We are f*cked because, even during d worst month (Oct.) last year — when the most number of tests we conducted in a day was 20K (JUST ONCE at that) (see horizontal red lines below) and the daily cases were <6K (horizontal blue lines) — our health care system was stretched to the limit!
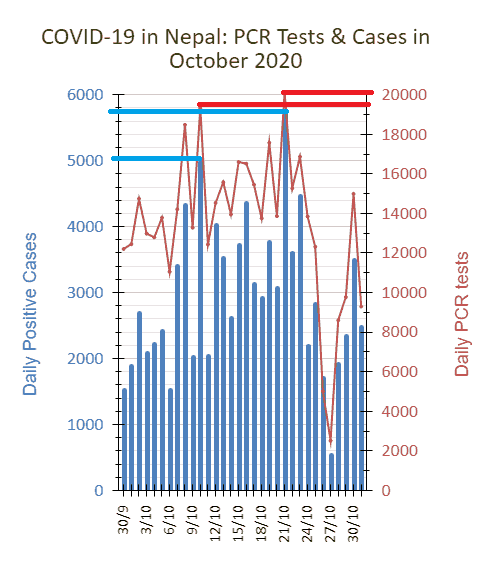
There’s no way we’ll manage >6K cases for WEEKS…unless…unless MoHP knows something — or a few different things — that I don’t…which is entirely possible…after all they did CORRECTLY predict negative growth rate for the November 2020-March 2021 period! But, even then, I am NOT counting on it!
Or, there is something about us Nepalis, about our immune system or whatever. As far as I know, no one has been able to explain how the pandemic APPEARED to come under control on its own between the second half of November 2020 and the middle of March 2021 (see the fifth chart above). We did NOTHING stringent really for containment and mitigation.
Having said all that, what must be noted is that, this time around, there are at least one confounding factor: the variants of the coronavirus — such as the one that originated in the UK. The UK variant in particular, already established to be within the population, is considerably more infectious and virulent.
Anyway, if you are interested in following how the daily cases and the caseload stack up against the projected numbers, return to this blog post periodically and have a look at the LIVE charts below. They’ll be updated automatically as and when the COVID-19 spreadsheet for Nepal that I maintain is updated.
April 21, 9:00 AM Update
We have been overshooting the MoHP April 13-projection-based daily cases by wide margins! By how much? See chart below.
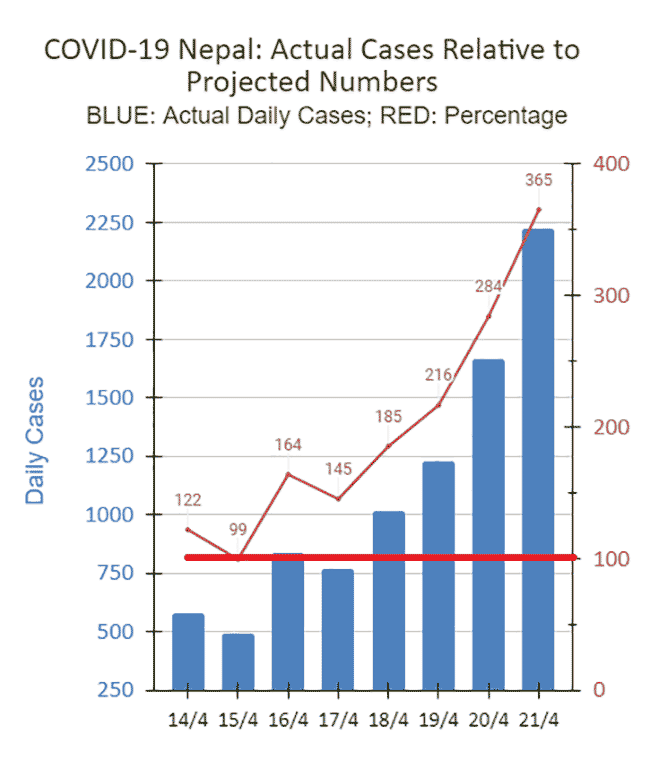
The following is a live version of the above chart.
April 23/25 Update
Seeing as the daily cases were overshooting by wide margins, I figured out a whole different projection based on the trend in the daily cases going all the way back to March 27. MoHP on April 24 also issued a new projection. They revised the 600K TOTAL to up to 800K ADDITIONAL cases by mid-July “in worst-case scenario.”
The following chart shows the actual daily cases, daily cases according to my own projection, and daily cases based on both the MoHP projections.
The following is a blown up version of the relevant section of the above chart to better show how the projected numbers stack up against actual daily cases.
The following chart shows the actual total cases, total cases according to my own projection, and both the MoHP projection-based total cases.
The following chart is a blown up version of the relevant section of the above chart to better show how the projected numbers stack up against the actual total cases.
To conclude, even if my projections don’t come true — and I hope and pray that they don’t — but something in between MoHP’s April 13 projection and mine, such as the April 24 projection unfolds, OR, miracle of all miracles, the April 13 projection unfolds, a DEVASTATING disaster is looming!
What do you think?
References
The Kathmandu Post (May 11, 2021). Nepal reports more Covid-19 deaths and record daily new infections. “An independent research shows the Indian double mutant variant, which a WHO scientist says is more resistant to vaccines, in some samples in the Valley.” [Added on May 12, 2021.]
The WHO. Tracking SARS-CoV-2 variants. As of July 6, 2021, eight variants have been identified — four of concern and four of interest. Of the four of concern, the Delta variant has been the most virulent. [Added on July 13, 2021.]
