Yup, after pretending to fight the coronavirus pandemic since about the middle of March, the Government of Nepal has thrown up their hands and given up. The government has pretty much declared that the show can’t go on anymore!
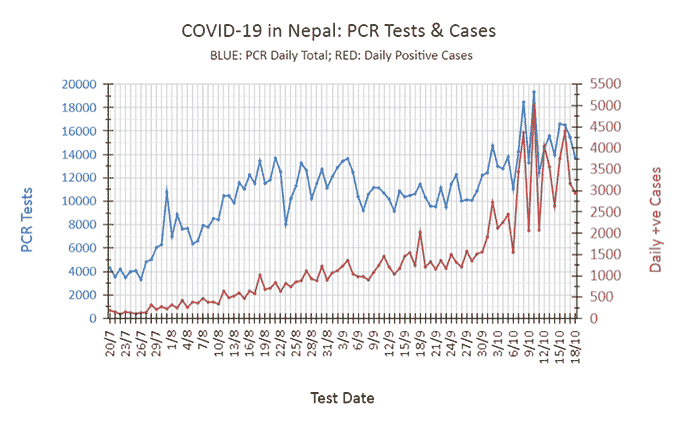
To begin with, following the lifting of the four-month long lockdown, the second wave began on July 28, seven days later — average incubation period of the virus.
Notice, three things in the chart above:
- there’s no consistency to the daily tests,
- the number of daily tests have been low, and
- the number of cases are rising in general.
The fluctuations indicate that the government did NOT have any strategy — did not implement any concerted mitigation strategy to control the spread of the coronavirus. A number of other data corroborate this.
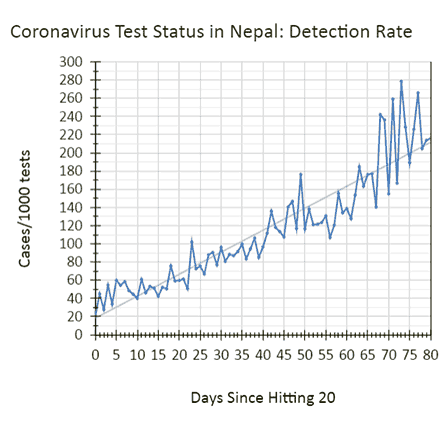
Not surprisingly, the detection rate has also been on an upward trend from July 31 (day 0 in the graph) as you can see in the chart below.
After rising for almost three months, it’s been hovering near 200 for the last several days! That means an infection rate of 1 in 5 of those tested! (What of the rate in the population?)
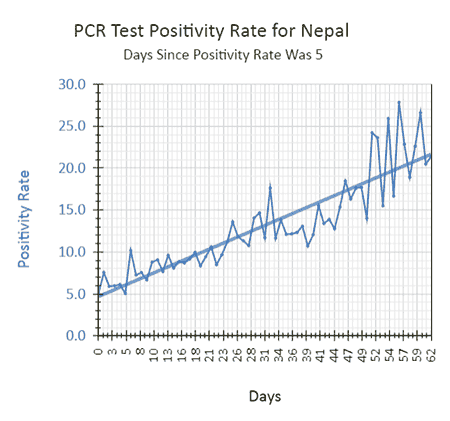
The following graph charts the days since the positivity rate was last 5% — which was Aug. 18 (day 0 in the graph below). Notice how it’s been rising in general the whole time for the last two months. The reason? Government of Nepal didn’t take any steps to increase significantly the testing rates.
A positivity rate of 5% or lower, according to the WHO, indicates that the pandemic in the country is under control. Clearly, the government hasn’t been too concerned about that.
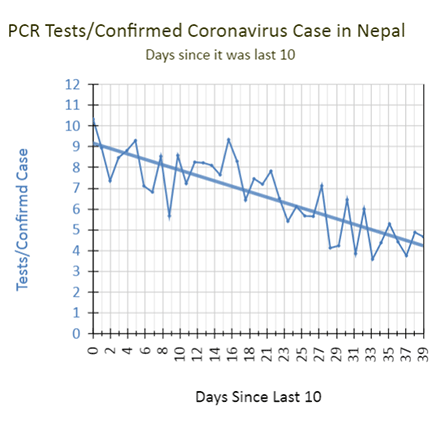
Next evidence is a graph charting the tests per confirmed case (see chart below). According to the WHO, when that is between 10 and 30, it denotes that the country is performing sufficient tests to detect sufficient infections in order to be able to control the pandemic — employing containment and mitigation strategies. But, again, as the evidence below suggests, we haven’t.
Number of PCR Tests conducted per confirmed case was last 10 (the minimum) more than a month ago AND has been declining steadily in general (blue trendline).
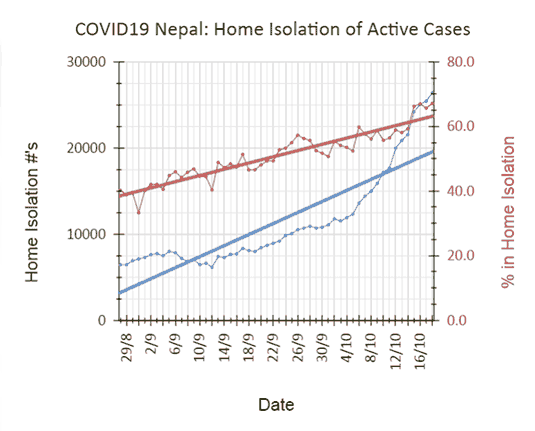
Far from implementing strategies to contain and mitigate, at some point during this fight against the pandemic, the government decided to send those testing positive to their own homes for isolation. The numbers for home isolation were first reported on Aug. 28 (see chart below).
Since then, their numbers have been rising steadily. As a matter of fact, the government sent proportionally more to home isolation than to institutional isolation. As you can see from the chart above, for almost a month now, more than 50% of active cases have been in home isolation! Unless you are middle or higher class, that could spell disaster for families, of course — simply for lack of space, if nothing else!
One of the ways sending active cases home benefits the government is by reducing their responsibilities and demand on resources and personnel at the hospitals. When the government hadn’t been doing much to improve or increase any of that, this served their purpose very well. This, not surprisingly, was followed by the government shirking further responsibilities, which I’ll get back to later.
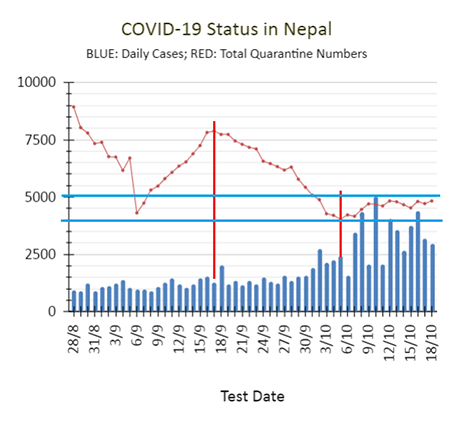
Not implementing a strategy of mitigation, data also show that the government had not been conducting anywhere near a thorough contact tracing program as demanded by the pandemic (see chart below).
Notice two things about the chart above:
- From Sept. 17 to Oct. 5, even while about 1500 cases per day were being reported, quarantine numbers dropped continuously, and
- From Oct. 5 to yesterday, quarantine numbers have gone up by no more than 1000 (range between the two blue horizontal lines) when over 42K cases had been reported during the same period.
I can think of only ONE explanation for that: severely limited contact tracing!
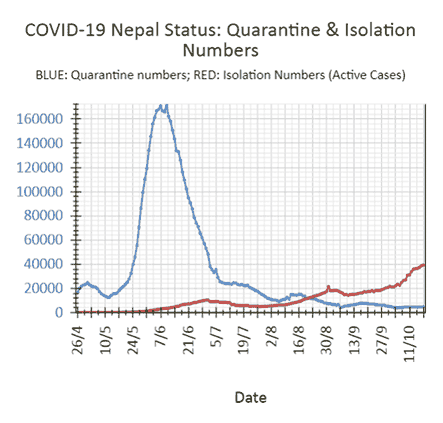
See chart below in contrast. The chart shows active cases and numbers in quarantine going back farther. Notice how the numbers in quarantine peaked way back in early June and reached a staggering 170K or so!!
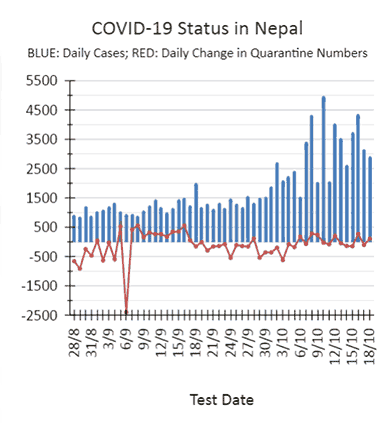
The following are two more charts that hit home the point I make. The first one shows the daily cases and daily changes in quarantine numbers.
The following one charts the active cases and numbers in quarantine starting from July 28, when the second wave began. Notice how changes in isolation (active cases) (red curve) contrasts very starkly with changes in quarantine numbers (blue curve)! Plus, notice how the general trend for the quarantine numbers (blue trendline) has been downward, especially since Sept. 16, even while the number of active cases have been continually shooting up!
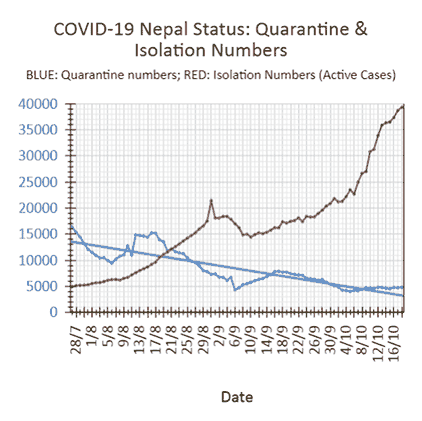 So, the government completely failed at fighting the pandemic. Limiting the numbers and, likely, the scope of PCR tests throughout was the biggest mistake. They also failed at conducting the necessary diligent contact tracing program from when the second wave started.
They implemented other questionable practices. One was them sending home — for isolation — a large percentage of those infected. Another was not expanding the government’s scope of testing and limiting them to only those with symptoms, something they decided recently, unless they were government officials or connected to them somehow. In order to under-report COVID-19 fatalities, they also issued a directive to not test the dead.
Another one of their failures was their appearing to have made little attempt to build the capacity of the hospitals. Far from it.
Of late, some members of the government appear to have “wrested control” of the very limited vital resources — ICU beds and ventilators — in Kathmandu. Hospitals in the valley, by all accounts, have been operating at “full capacity” for a week or so already when it comes them. Ministry of Health and Population’s daily Situation Reports, however, indicated their availability…and then the truth came out.
.Here it is:
‘“We have to hoard ICU beds
because you never know when
you will get a call from a VIP
or a minister who wants someone
admitted,” says one doctor who
didn’t want to be named for this article.’#Nepal #COVID #COVID19 #COVID19Nepal https://t.co/UEstGlPWQr— Dorje Gurung, ScD (h.c.) (@Dorje_sDooing) October 12, 2020
And now, over the last two days, the government has stopped reporting on the status of ICU beds and ventilators in Kathmandu hospitals.
The first image shows the use & availability of ICUs & ventilators in Kathmandu hospitals as reported in d Oct 17 Siruation Report. Images 2 & 3 show sections of d Oct 18 & 19 reports where the info would have appeared. #Nepal #COVID #COVID19Nepal pic.twitter.com/qIHW5IXQmI
— Dorje Gurung, ScD (h.c.) (@Dorje_sDooing) October 20, 2020
Not surprisingly, just recently, an article published proof of the government under-reporting COVID deaths.
As if all that wasn’t enough, just a couple of days ago, the government changed the protocol for the disposal of COVID-19 dead. Families now are responsible for making arrangements for and handling everything associated with the last rites of patients who die at home. Remember, as of yesterday almost 27K active cases are in home isolation. Might I remind you, again, that disproportionately higher and higher percentage are being sent home for isolation.
Also recently, the government announced that they would provide neither financial assistance with expenses related to PCR tests — which will no longer be free — nor free medical treatment nor assistance with hospitalization expenses.
As far as average Nepalis are concerned, the government of Nepal has ceased to exist! It’s essentially collapsed. But then again…when did the Government of Nepal actually exist to serve those who need it the most during it’s entire history?! The individuals in the government have always, mostly, served themselves, including during the last several months of these stressful and, to many, deadly times of the coronavirus pandemic.
What do you think?
(If interested in other blog posts about the status of COVID-19 in Nepal, click here, here, here, here, here, here, here, here, here, here, and here.)

