Of course, it was just a matter of time before COVID-19 caught up with Kathmandu thanks to the completely lassaiz faire approach of the Government of Nepal towards the pandemic.
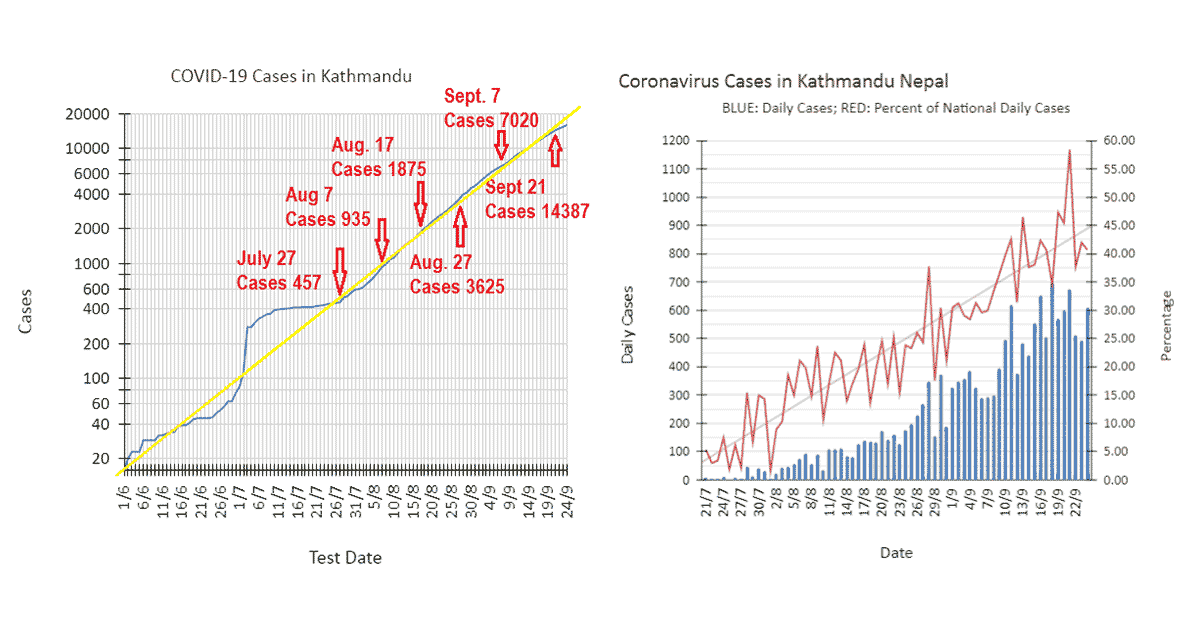
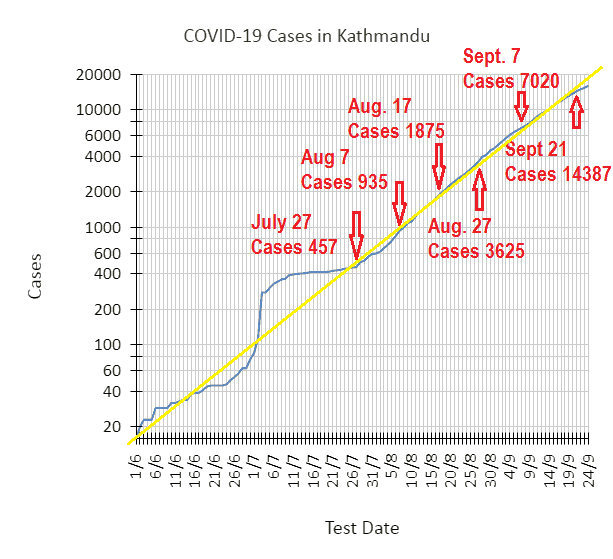
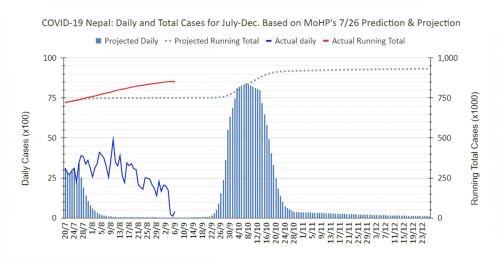
During the first wave, no different from how it was in the entire country, the slow and little rise in cases slowed down on July 3 (see image below). Then the lockdown ended on July 21.
Not surprisingly, number of cases started picking up from July 28, a week after the end of the lockdown. From then on, the cases have been rising exponentially, as you can see in the image below.
| Cases | Days |
| 1 to 457 | 185 |
| 457 to 935 | 12 |
| 1 to 935 | 197 |
| 935 to 1875 | 10 |
| 1 to 1875 | 207 |
| 1875 to 3625 | 10 |
| 1 to 3625 | 217 |
| 3625 to 7020 | 11 |
| 1 to 7020 | 228 |
| 7020 to 14387 | 14 |
| 1 to 14387 | 142 |
| 14387 to 28700 | ? |
If the above trend is maintained — which I see no reason to not be given the lack sufficient mitigation measures — we’ll reach 28700 cases in Kathmandu in just another two weeks or so! If you are interested to see if indeed that comes to pass, you can return to this blog and check the following live version of the chart.
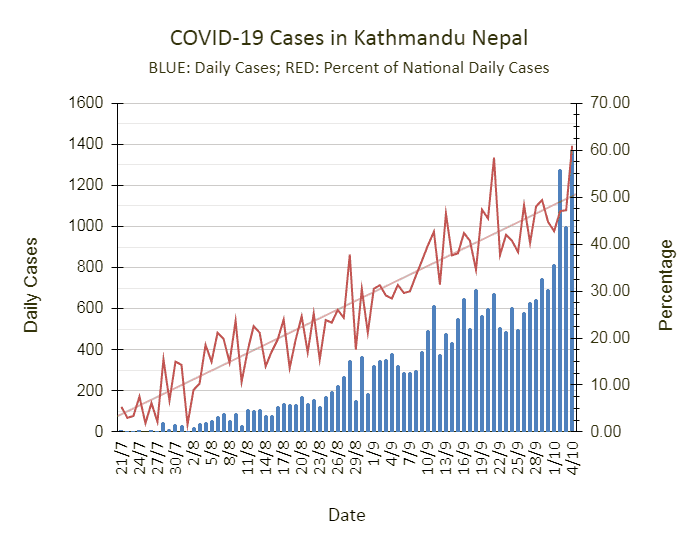
The daily cases in Kathmandu have been growing so fast as a matter of fact that they have represented an increasingly bigger percentage of the national cases (red curve in the chart below). Today, it exceeded 60% (see image below).
If you would like to check out how it has progressed in the future, come back and have a look at the live version of the above chart below.
The following graph charts the daily cases (blue histograms) and the rolling three-day averages (red curve).
One reason behind the increasing trend in cases in Kathmandu may well be a high rate of transmission. The other could be the higher test rate in the valley compared to the rest of the country.
To begin with, here are the details of the testing centers by province.
| Province | No. of Test Centers |
| Province 1 | 4 |
| Province 2 | 5 |
| Bagmati | 27 |
| Ghandaki | 2 |
| Province 5 | 8 |
| Karnali | 4 |
| Sudurpaschim | 4 |
| Total | 55 |
In other words, 27 out of 55 centers, about half (49%) of all test centers are in Bagmati Province, where only about a fifth (20%) of the population of the country reside. Furthermore, 18 of the 55 (32%) are in Kathmandu Metropolitan City, where only about a twelfth (8%) of the population of the country reside, something I pointed all that out in a two-tweet thread last month.
Wondering why Dr. KC stages hunger strikes again & again?
Here’s 1 consequence of d corrupt #MedicalSystem he’s fighting to dismantle & improve:
Total PCR test centers=51
Centers in Bagmati Province (BP)=27 (53%)
Pop. of BP= ~20% of total
See d problem?#Nepal #IAmWithDrKC pic.twitter.com/EUKAli9jNt
— Dorje Gurung, ScD (h.c.) (@Dorje_sDooing) September 26, 2020
.And how does that show up in d data?
Check d tests conducted in Kathmandu relative to the whole country (green “curve”). It exceeded 50% today! (& notice the trend line!)
In other words, half of all tests were conducted where <10% of the population reside! #Nepal #COVID19Nepal pic.twitter.com/wLQzzzyWRM
— Dorje Gurung, ScD (h.c.) (@Dorje_sDooing) September 26, 2020
The country is preparing for the biggest national (Hindu) festival of Dassain. As the most important holiday, people return to their home districts and villages to be with their families. Kathmandu sees huge exodus of the population. Destination? Everywhere in the country.
While that may — MAY — bring about a temporary slow down in the spread and growth of cases in the valley, it could spell disaster for other areas where number have been relatively low — whether really because they are low or because of lack of testing. Overall however, should business as usual prevail this festive season, this humanitarian crises could worsen by a few fold in a very short period of time!
What do you think?
(If interested in other blog post about the status of COVID-19 in Nepal, click here, here, here, here, here, here, here, here, and here.)

