Given the complete lack of strategy on the part of our Government to tackle the coronavirus pandemic, the end of the four-month long lockdown 1.0 on July 21 did NOT bode well for the country. One of the things I have been doing on Twitter is to expose that by sharing my own observations of the progress of the pandemic offering my own observations. The observations are based mostly on charts I generate using the Google Drive spreadsheet I maintain. My data source are the situation reports published by the Ministry of Health and Population.
Reproduced below, with some minor corrections, please find the content of the tweet thread I shared on September 10. I preserved the format of the tweets, hence the appearance, as well as the language. (I opted to do this — over embedding the tweets — for ease of viewing the charts. Please don’t mind the hastags and the language!)
1/
#COVID19Nepal Update
GoN lifted #lockdown 1.0 on July 22 & 7 days later, #SecondWave began.
On Aug. 19, introduced a no. of prohibitions which ended yesterday.
BUT #DATA show
- GoN did little to #mitigate spread, & (so)
TREND towards a worsening of d pandemic. #Nepal
.2/
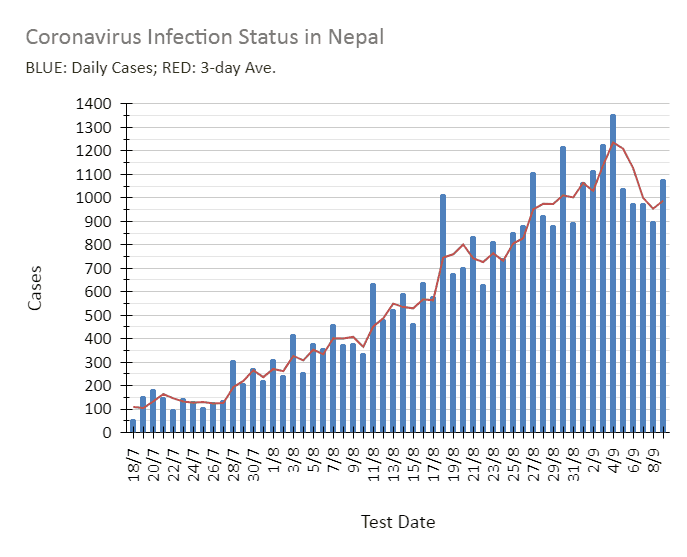
Chart above, showing a DECREASING 3-day ave. daily cases from 4/9 is just false hope as far as data is concerned!
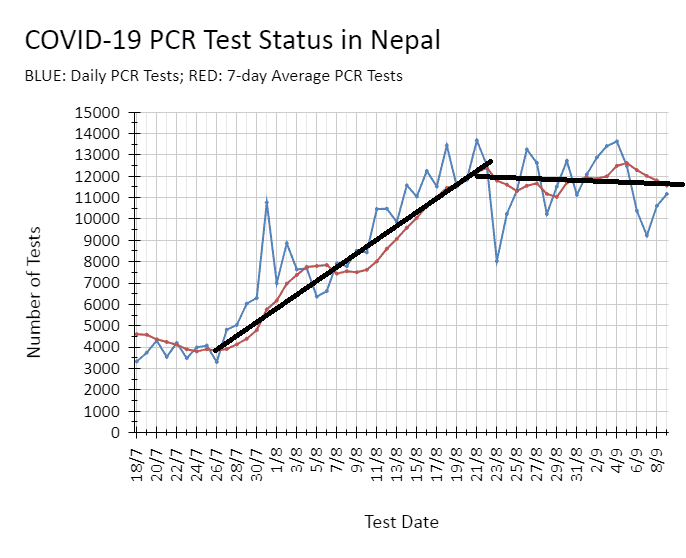
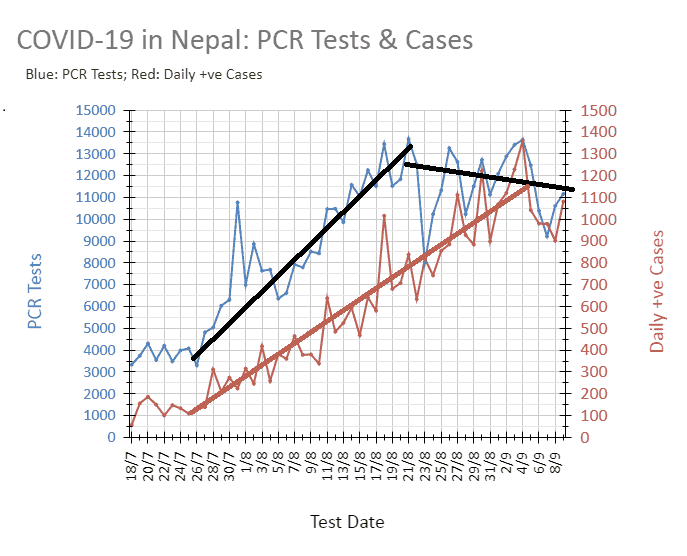
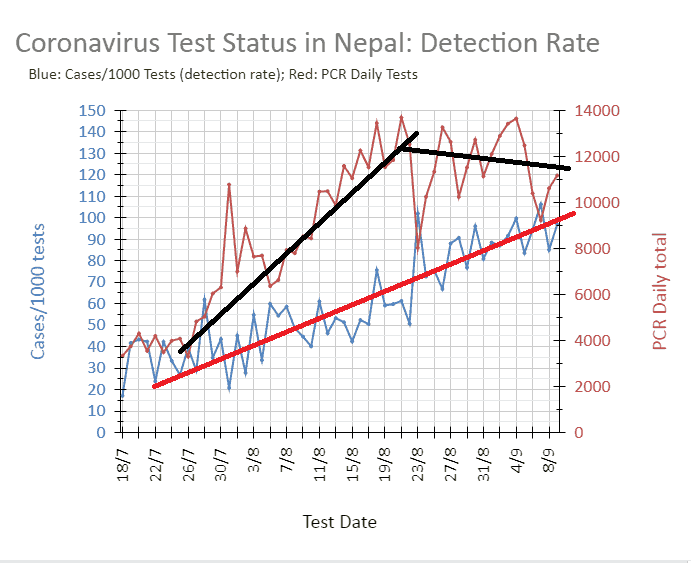
From when d 2nd wave began, GoN bumped up d daily PCR tests (though NOT sufficiently which I’ll come to later) but only until Aug. 21 [black trend lines in image below]. #Nepal #covid19nepal
.3/
After an increasing trend (orange trend line) since about July 26, ave. cases/day (& therefore 3-day ave.) started dropping from Sept. 4.
That’s two weeks after ave. tests/day pretty much started remaining constant (2nd black trend line). #COVID19 #COVID19Nepal #Nepal
.4/
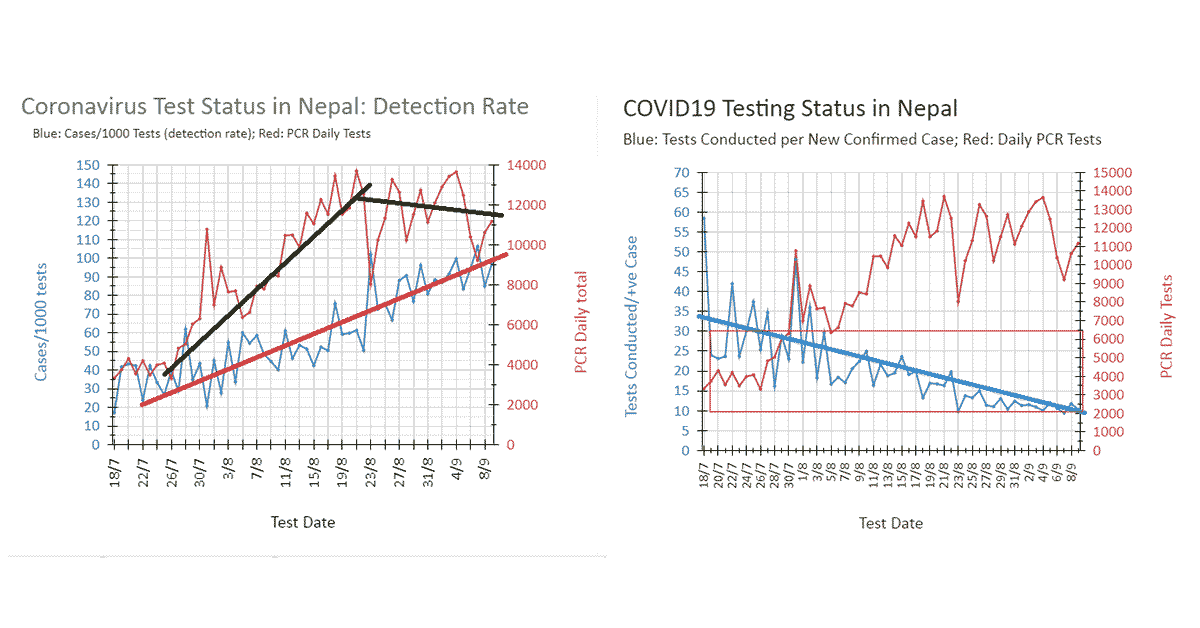
Why decreasing 3-day ave. cases is false hope & why GoN has not AGAIN done a good job of #mitigating d spread of #coronavirus:
- #DetectionRate (cases detected per 1000 tests conducted) is still trending upwards (red trend line). #Nepal #COVID #COVID19 #COVID19Nepal
.5/
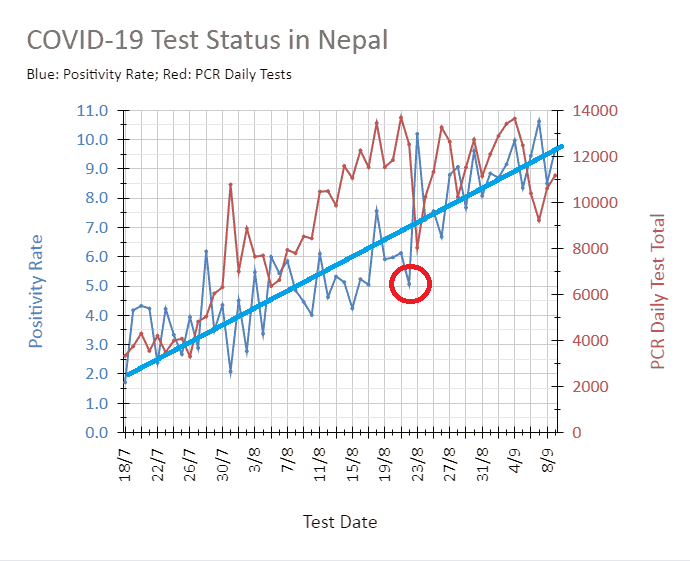
2. #PositivityRate (% of those who tested positive) continues to trend upwards (blue trend line) after surpassing 5% (red circle) on Aug. 22.
(<5% positivity rate indicates country has brought the #pandemic under control.)
#Nepal #COVID #COVID19 #COVID19Nepal #coronavirus
.6/
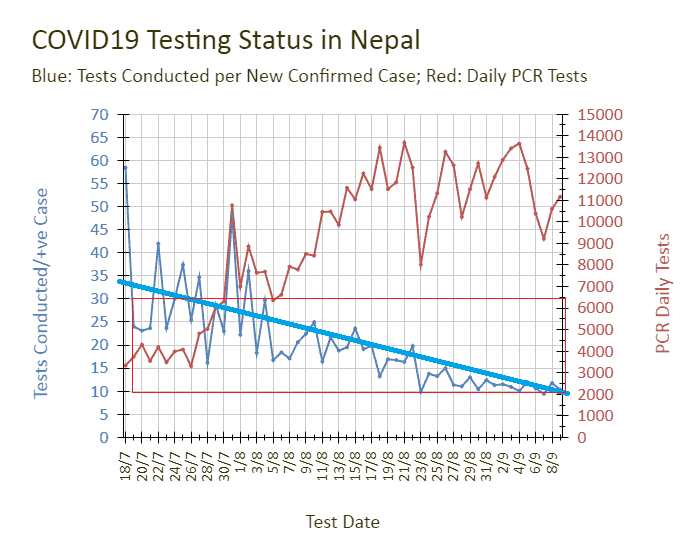
3. Tests conducted per confirmed +ive case detected continues to fall (blue trend line).
A no. b/ween 10&30 (red rectangle) indicates that d country is conducting sufficient tests.
It has hovered b/ween 10&15 since Aug. 23. #Nepal #COVID #COVID19 #COVID19Nepal #coronavirus
.7/
To reiterate something from another thread (https://twitter.com/Dorje_sDooing/status/1300687867354595328 [embeded below]):
To #FlattenTheCurve, GoN’s #strategy MUST ALSO be #mitigation.
For effective mitigation (& thereby reduce #PositivityRate for eg.) we MUST INCREASE testing numbers. #Nepal
#COVID #COVID19 #COVID19Nepal
1/
Comments on how & why we failed with d #containment of #corinavirus & #mitigation of it spread using d #data we have–as random & limited as they are–& what must happen as far as containment & mitigation are concerned. #Nepal #COVID #COVID19 #COVID19Nepal
cc. @_bishalbhandari pic.twitter.com/hdtbRzHEcl— Dorje Gurung, ScD (h.c.) (@Dorje_sDooing) September 1, 2020
.8/8
If you are interested in the Nepali version of the tweet thread I shared the link to in the preceding tweet, here it is: https://twitter.com/Dorje_sDooing/status/1301043551661252609 [embeded below]. #Nepal #COVID #COVID19 #COVID19Nepal #coronavirus #pandemic
१/
कोरोना virus #contain र #mitigate कसरी र किन हाम्रो सरकारले पहिलो चरणमा गर्न सकेन? यो सम्बंधी हामीसंग भएको सिमित dataमा आधारित एउटा commentary, अनि के हुनु/गर्नु पर्छ |तलको चार्टले #coronavirus ले संक्रमण गरेको संक्या र कसरी वड्दै छ भन्ने देखाउछ | #नेपाल
cc. @rameshsmit pic.twitter.com/GY9yNCWJpB— Dorje Gurung, ScD (h.c.) (@Dorje_sDooing) September 2, 2020
What do you think?
(If interested in other blog post about the status of COVID-19 in Nepal, click here, here, here, here, here, here, here, here, and here.)

