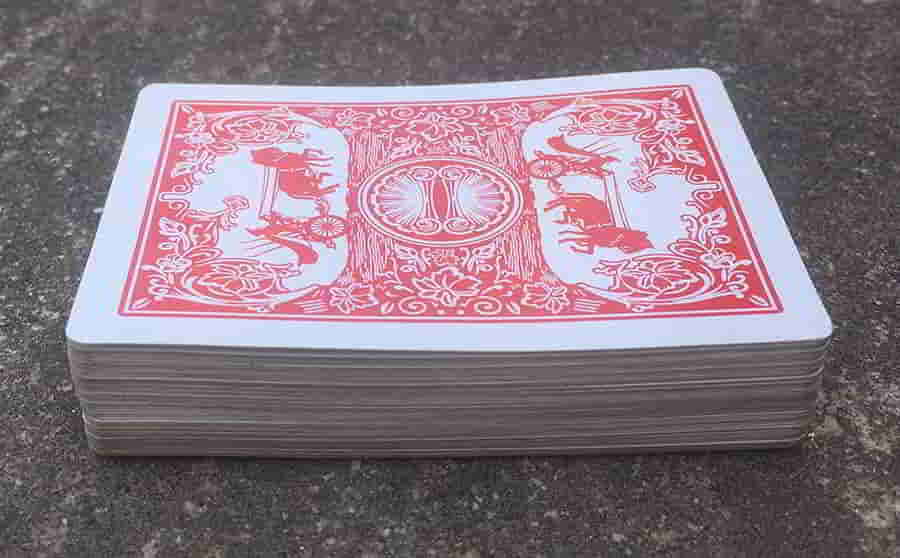
This playing card problem is actually very topical as it’s about exponential growth, the manner in which coronavirus (COVID19) spreads. Of course, I have an extension to the problem which delves into that. This is a problem I have assigned my students in the past as well as to the teachers in my teacher education workshops.
For this problem you’ll need a card, a ruler, and the internet.
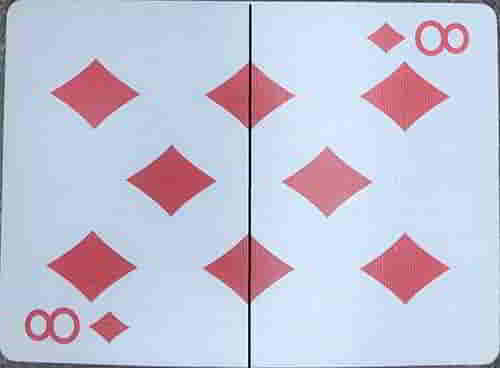
- Take a single card (like the eight of diamond shown below). Tear it in half (like along the black line in the image). Stack the two halves of the card, i.e. place one on top of the other.
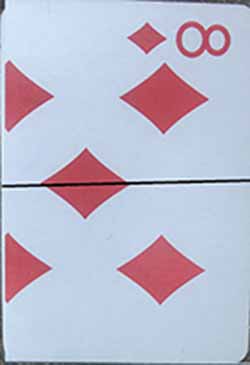
- Tear the stack in half, along the black line shown in the image below, and stack the halves again just like before,
- Tear the stack along the black line shown below, and stack the pieces again. This may be as far as you get with an actual card.
This is NOT possible BUT imagine continuing the tearing-and-stacking-and-t
Here’s the question: Will the imaginary stack of pieces of the card at the end of the process reach the sun?
If you attempt the problem and were able to find the answer, you would have noticed that the number of pieces grows exponentially.
Next, imagine the pieces of the card represented cases of coronavirus infections in your city. Imagine your city started with 3 infected individuals (the card you started with). Imagine every 3 days the same happening to the number of infected individuals as happens to the card pieces every time you tear a stack up.
Applying the figures from the card stack problem to this scenario, determine the number of days it would take for the number of coronavirus infection to reach the first 50,000.
Assume no interventions (i.e. NO mitigation and containment steps) of any kind is introduced in your city. How many days would it take for the number of coronavirus infection to reach 200,000?
Extensions:
- Draw a graph charting the growth of the cases of coronavirus over a period of time within which the pattern is clearly visible.
- How would the graph change with intervention (such as for example with lockdown) introduced in the third week?


