Namaste!
In this blog, I shall be sharing pertinent information and resources for citizens of Nepal on the coronavirus and COVID-19. To begin with here’s some information from the Ministry of Health and Population’s page Coronavirus disease (COVID-19) outbreak updates & resource materials.
First off, the Ministry has set up hotlines for anything and everything related to COVID-19.
The numbers: 9851255839 [९८५१२५५८३९], 9851255837 [९८५१२५५८३७], 9851255834 [९८५१२५५८३४] Hours: 8 am – 8 pm, everyday. |
You can also access NCell and NTC “Call Centers.”
Call Center number: 1115 [१११५] Hours: 6 am – 10 pm, everyday. |
The page also includes infographics on Do’s and Dont’s and those intended to raise Public Awareness about the virus and the disease, such as the need to be vigilant of symptoms and to wash ones hands with soap, regularly.
In addition to that, the Ministry has been publishing Situation Reports — a PDF-format document with the latest updates. So far, they have published 43. The reports include, among other things, a running total of tests conducted and their results.
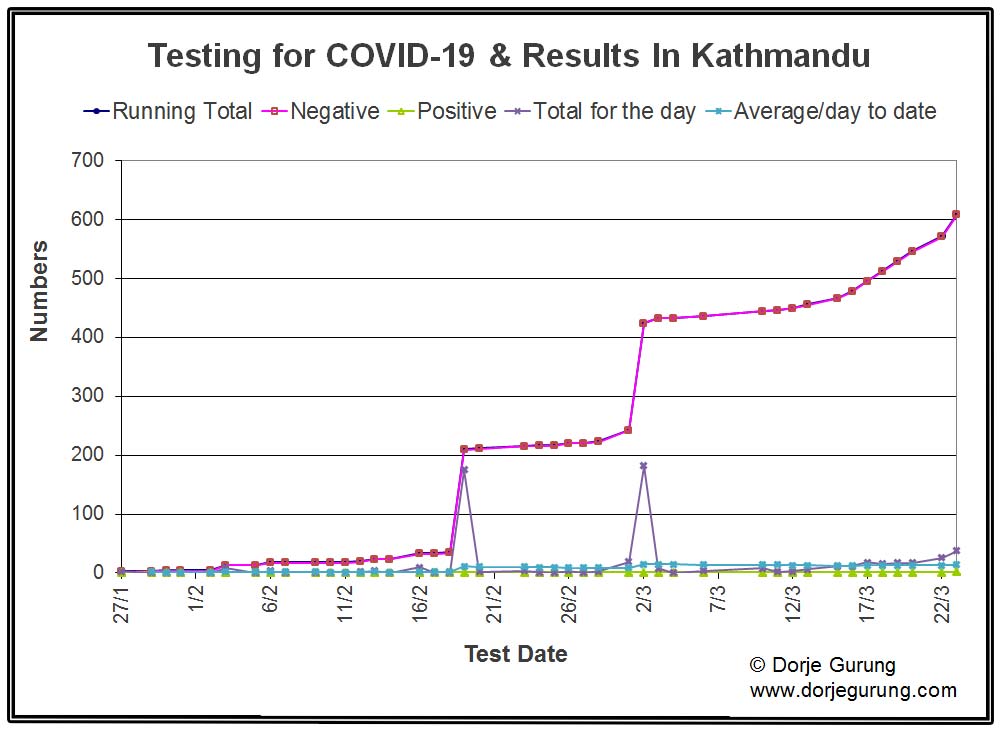
Using that data, I have gone ahead and calculated the number of tests conducted each day, and the running average tests per day. Here’s the result for until today!
The reason you can’t distinguish between the Running Total and number of those that tested Negative is because they are different by just one — the number of those testing positive! One is too small a difference to show up on the graph given the scale of the y-axis.
That did change yesterday when a student returning from France was tested positive! The sole person who had tested positive was, interestingly enough, one of the first ones to be tested, if not the first one, way back towards the end of January. So the total testing positive in the country stands at two!
For the same reason — the numbers being too small — it’s difficult to tell the numbers the rest of the lines represent, except for the two spikes! The second spike representing total tests conducted on that day, from what I understand, is a mistake. Apparently, they just counted twice the 175 who were tested the first time around, indicated by the first spike. That means the total tested is even less than 500 instead of the slightly more than 600 shown on the graph.
If you can’t tell, the daily average is really low in spite of the fact that we have been testing for the infection for almost two months, from since toward the end of January! We have NOT been testing enough!
If you would like to view the most up-to-date graph, click here. (It will take you to the live version of the graph on Google Drive which updates itself as and when I update the data with the most recent numbers.)
The Situation Reports also include all the work being done in different provinces in response to the pandemic. I have at least a few issues with the situation reports too and this mode of keeping the population informed but I’m going to leave that for possibly another blog post.
Something else that the Government of Nepal did is to empower the Police to crack down on people disseminating “fake news” related to coronavirus.
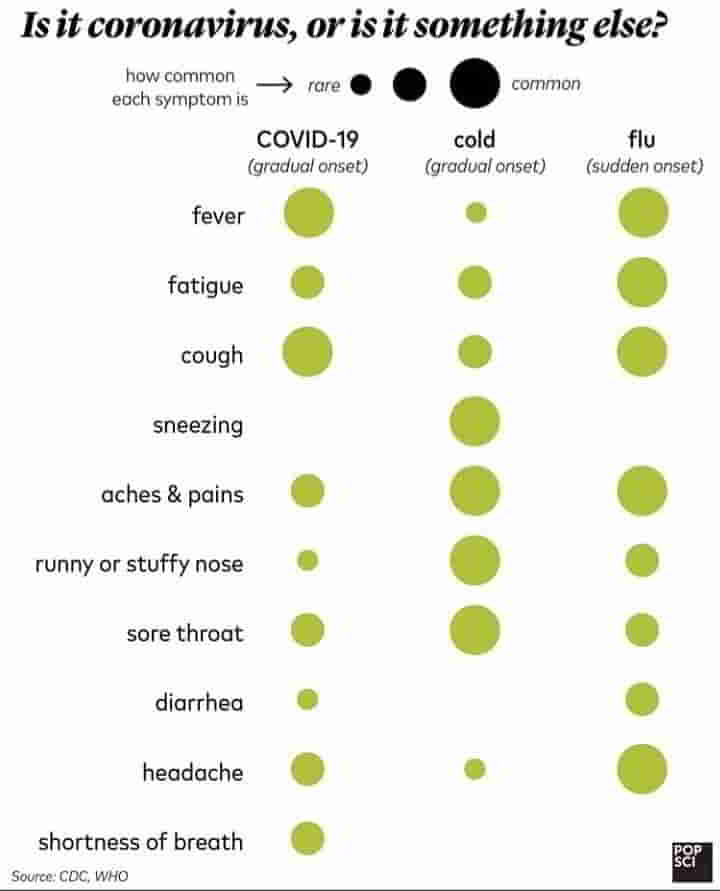
Regardless, if you are still wondering how one distinguishes symptoms arising from coronavirus infection from similar ailments, here’s a run through of all the symptoms, and how they compare and contrast with cold and flu.
As for the need to wash your hands including under the nails with soap and water, preferably for about 20 seconds…here’s a little bit of science behind that.
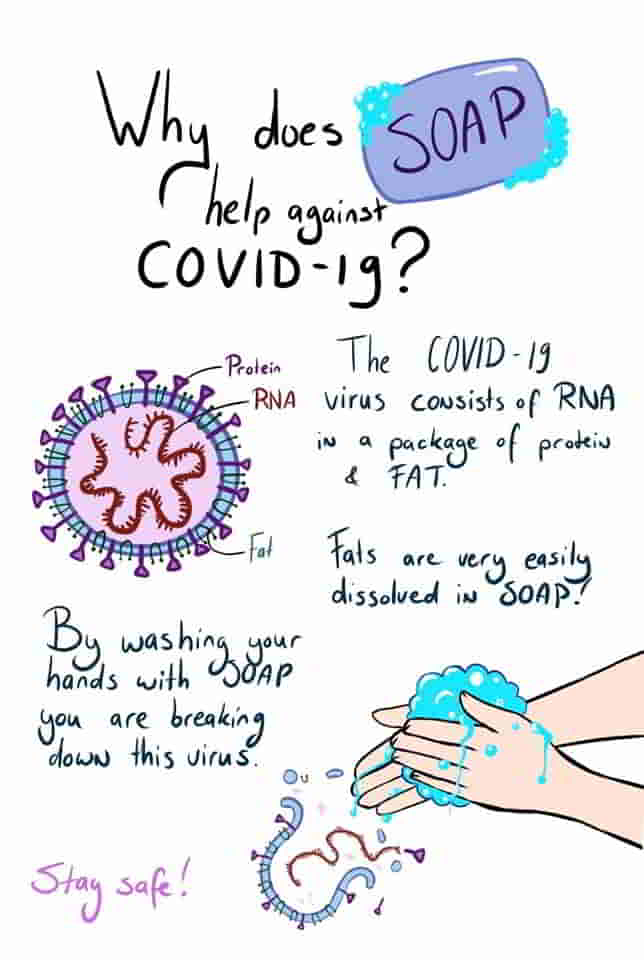
Soap has both a polar and a long non-polar end, the latter dissolves the non-polar fat encasing of the virus. (If you are a high school chemistry student, and want to refresh yourself on polarity of molecules, follow this link.)
If you are interested in a well written article published in the country i would recommend the one published by The Record.
One of the mis-information I have come across is the argument that since in the first three months of the coronavirus pandemic, it killed less people around the world than the flu has been killing in the same time period, it’s not as dangerous as the flu. Among a number of differences, one is that the two spread in different modes. Coronavirus spreads exponentially which is NOT how the flu spreads. Therefore the total lives claimed by it in a year COULD well far exceed that claimed by the flu. Watch the video below for all the details.
If you were introduced to ecology in secondary school, the graph might look familiar. Here’s a hint: (exponential growth of) population! (In math you may have learned it as a geometric progression.)
And here’s the data that confirms that!
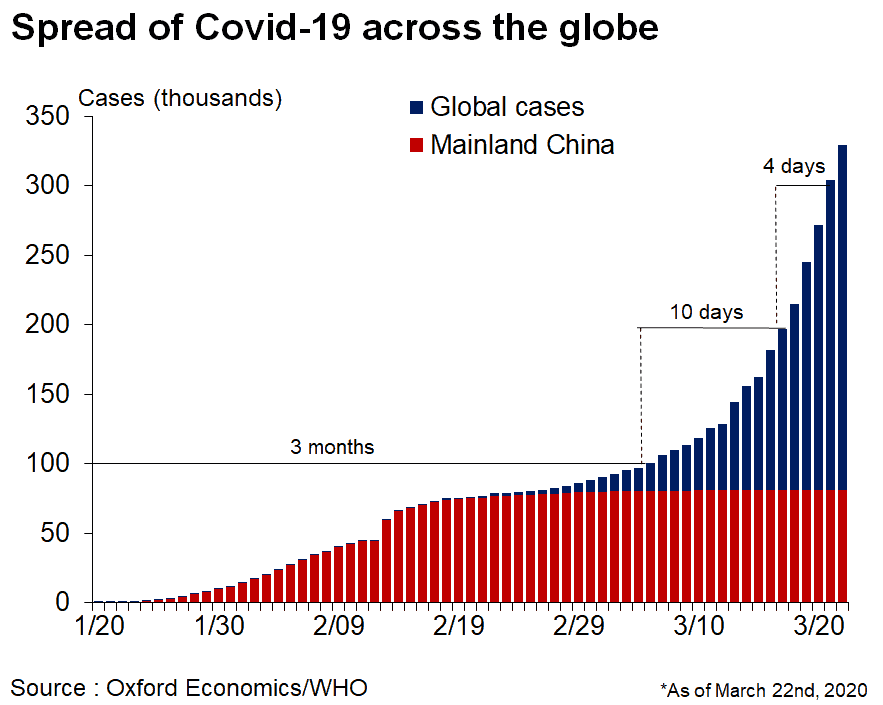
Total cases 10 days after that = 200,000
Total cases 4 days after that = 300,000
One last thing about exponential growth: Were it not for that, a fertilized egg, a SINGLE CELL would NEVER grow to be a fully formed baby in the womb of a woman in just 9 months!
The best way to slow down that rate of spread (and in turn the death rate from infection), at the individual level, is to practice social distancing. I have been on self-isolation — spending most of my time at home — for over a week now already. I welcome the Government of Nepal’s complete week-long lockdown of the country starting this morning. (Click here for a complete list of the guidelines for the lockdown.)
That is NOT to say that staying hunkered down in ones home is easy and without any suffering! Of course this will be tough especially for the homeless, the poor, the day laborers, the daily wage earners, and those who live in very crowed quarters, among others.
However, social distancing helps contain the coronavirus and mitigate its spread. If as an individual you reduce the number of contact with different people, the chances that you’ll be infected reduces as well because the chances that you’ll cross paths with an infected person — or an asymptomatic carrier of the virus — will be lowered. Or, if you are infected or an asymptomatic carrier, social distancing will reduce the number of people you might pass on the infection to.
To reiterate, social distancing, by dramatically reducing the interactions between people whether one-to-one or in big groups, reduces the potential for passing on the virus by infected individuals or by asymptomatic individuals to others. In other words, it dramatically reduces the rate of infection, which in turn keeps the number of those infected lower than were social distancing NOT practiced, which in turn DRAMATICALLY reduces the death rates.
At the national level, testing its citizens and quarantining those who test positive and everyone else who have had social contact with them is the way to contain the virus. But in order for that to be effective at all testing must be carried out at much MUCH higher rate than we have been.
The argument is that, if the rate of infection is kept low enough, the medical system might just be able to manage them (see image below). Otherwise, it may be so overwhelmed by the number of cases that it might NOT be able to provide the kind of care all the patients need or even most of the patients need, including those that are suffering from other illness. That, in turn, drives the death rates up!
That essentially is what “flattening the curve” that you may have heard about is all about (see image below). Time zero is the start of the pandemic, and the curves chart the number of cases (infected people) over time. The curve skewed to the left represents the changes in the cases over time with no intervention of any kind. The broader and flatter curve to the right is what results with with intervention.
Flattening the curve in this case is all about containment and mitigation, which can be brought about, as I already mentioned, by social distancing.
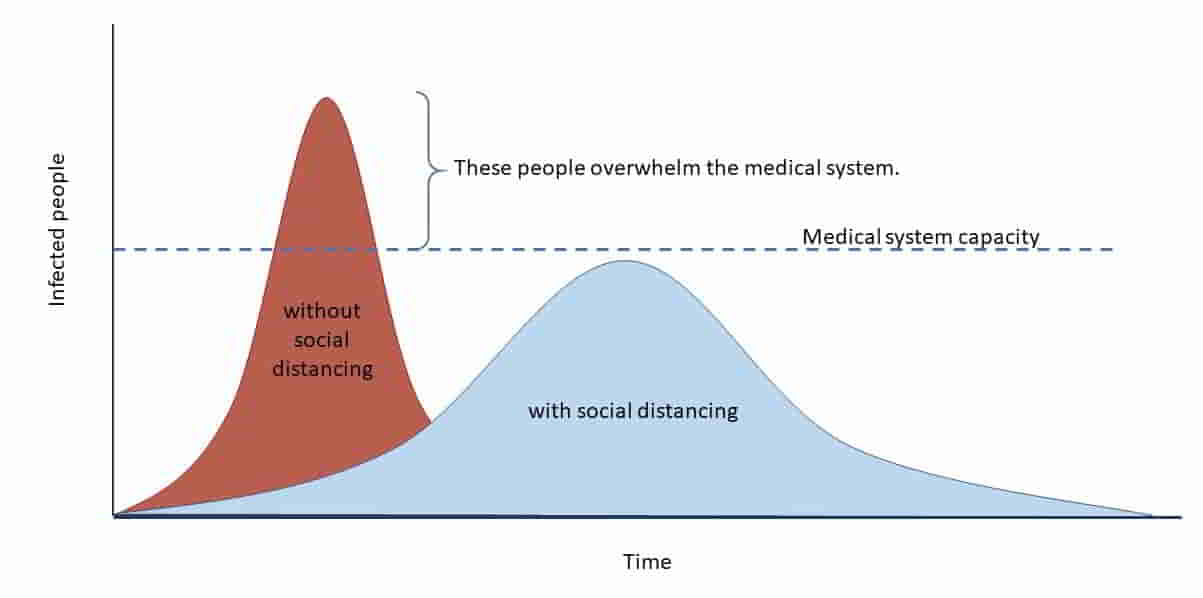
So, with social distancing, three things happen: firstly, the peak does not reach anywhere near as high; secondly, the peak is reached at a later date; and, thirdly, we will have to deal with the pandemic for a longer period of time BUT at a pace the medical system can manage without overstretching itself.
Now, if, during this uncertain period of lockdown, you find yourself in an unsafe place in Kathmandu, here’s an organization that could help you (see image below). Or maybe you know someone in the valley who is NOT safe and could use their help. It appears to be an organization driven to making sure everyone in the valley is in a safe place during the lockdown.

And finally, if you have children who are struggling to entertain themselves or if you are worried that they are NOT spending enough time on their academics 😀 :D, you can get them to try my “Brain Tease: Logical and Scientific Problems” found on my Facebook Page. My science blog also contains many resources for students, the Enrichment Activities specifically. Click here for Enrichment Activities for children in grade 7 and 8; here or here for those in grades 9 and 10, and here for those in grades 11 and 12.
Please keep yourself safe…and others as well by social distancing!
Namaste!
(If interested in other blog post about the status of COVID-19 in Nepal, click here, here, here, here, here, here, here, here, and here.)

