A while ago, I published a whole blog post about the scam the Nepali textbook publishing industry is. As far as I can tell, the industry does not have, as its priority, the education of the children. The textbooks I have seen have all been of horrendously poor quality. (You can read about some them here, here, here and here. I’ll reiterate something I have said before on the subject of Nepali school textbooks: they hinder our children’s learning and should be removed from schools.)
Here’s yet another example of such a textbook: a grade 8 science book.
Back in early September last year, I was conducing my teacher education program at a local private school. One of the things I did was to conduct lessons so that the teachers could observe how they could be conducted differently. Pretty much every such lesson have often been about how they DON’T have to teach from the textbook AND that they don’t need a lot of fancy instruments and resources to make science fun, exciting, engaging, and interesting.
With the grade 8 science teacher I was working with, when it was my turn to teach, the topic was Climate Change.
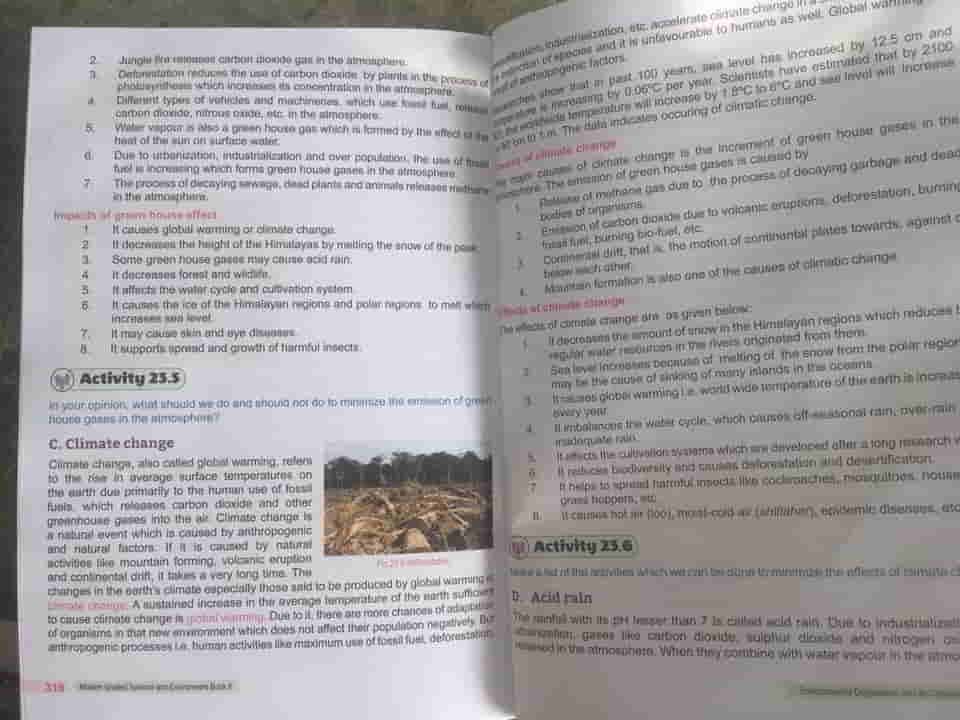
Taking a look at the entry in the textbook, I noticed that it was no different from entries on other topics I had seen in science textbooks in the past: it was very very dry (see image above). Using one or more examples of natural disasters that have occurred in the last several years, the cause of which can be traced to Climate Change, would have been one of the better ways to cover the material. But that’s not what it did.
But, guess when it says the the book was last revised and updated though? 2018 (see image below)! Yes, just the year before! But of course this is all, as I have stated at outset of this blog post, just a scam!
Of course, I completely ignored the textbook! I had just checked it to see what I was supposed to teach! What I did instead was to go to God, aka Google, and “ask” for the graphs that chart the changes in concentration of greenhouse gases (carbon dioxide and methane) and average global temperature over time, all of which I knew existed.
And, here they are, not in any kind of order.
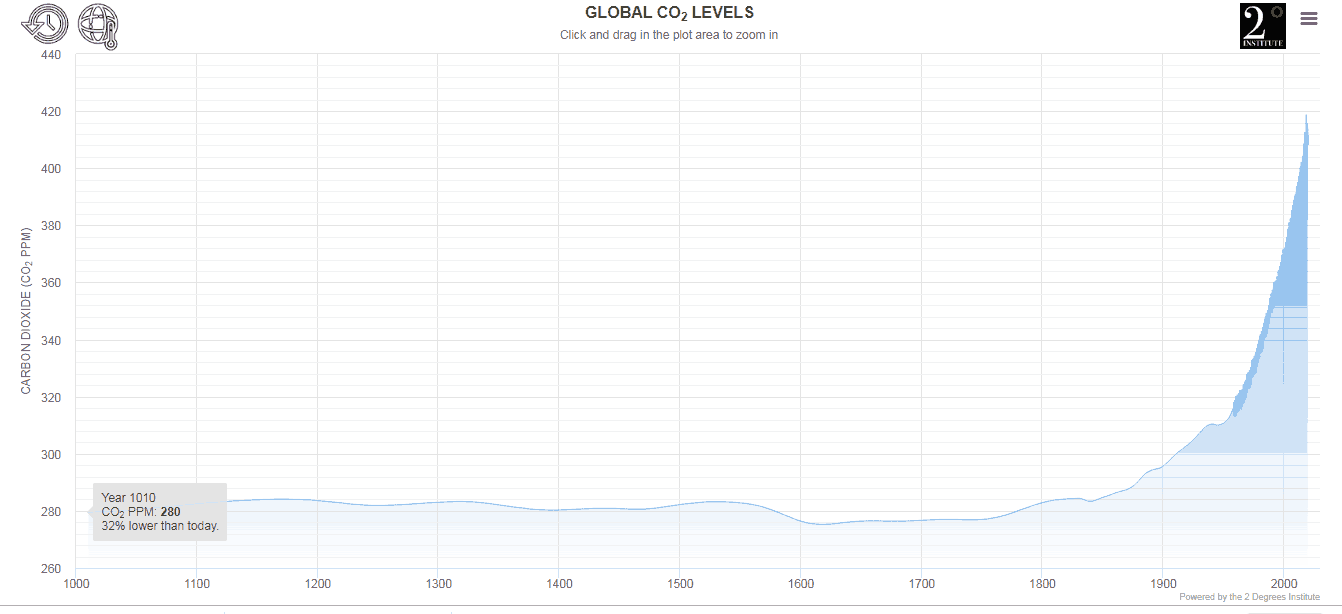
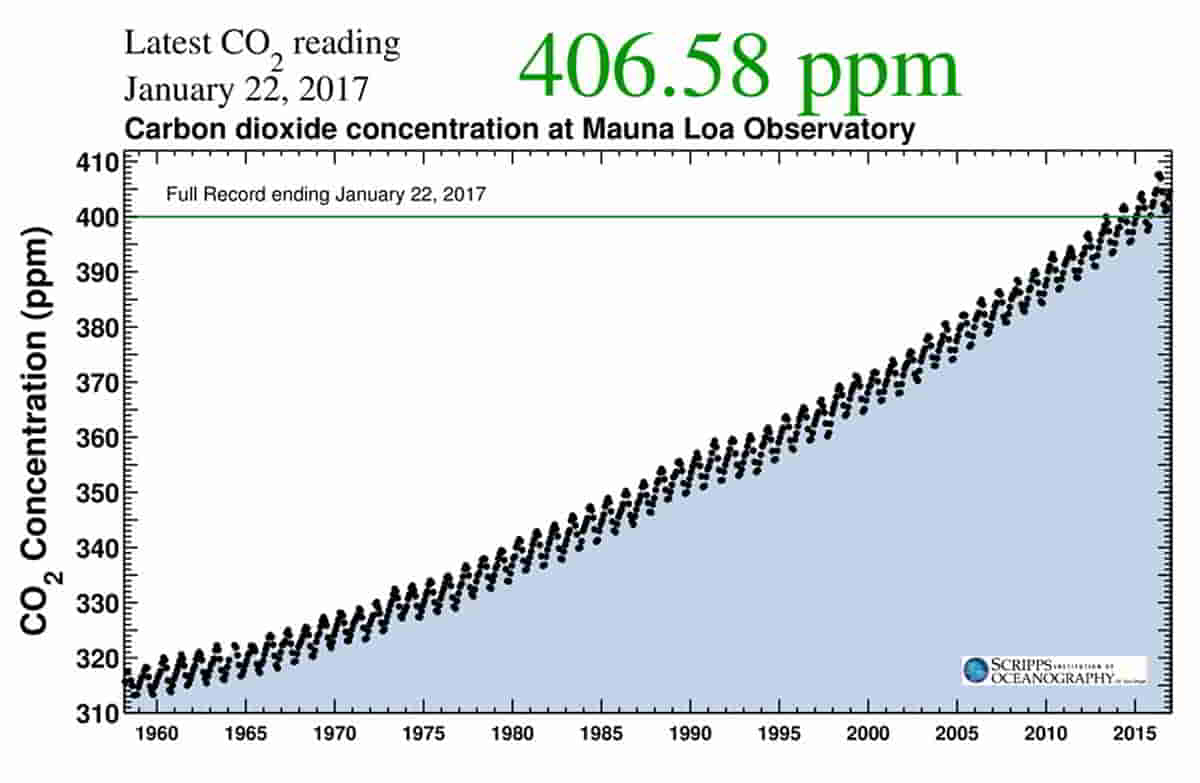
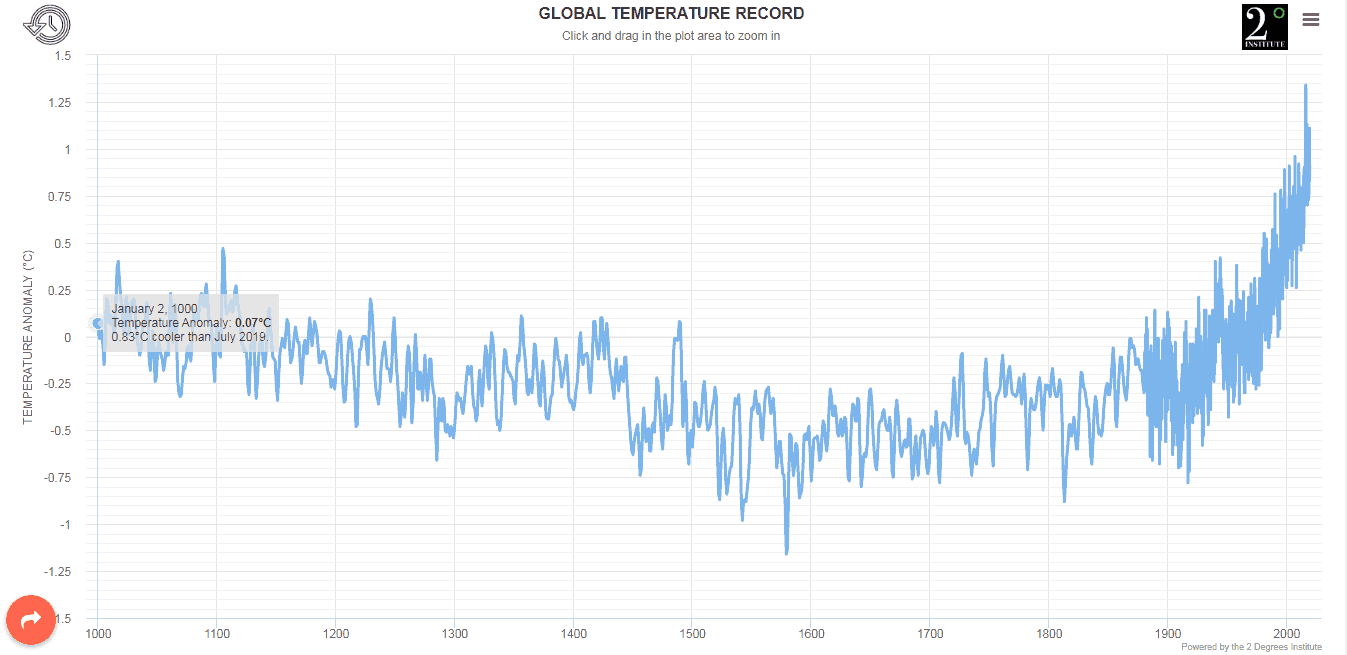
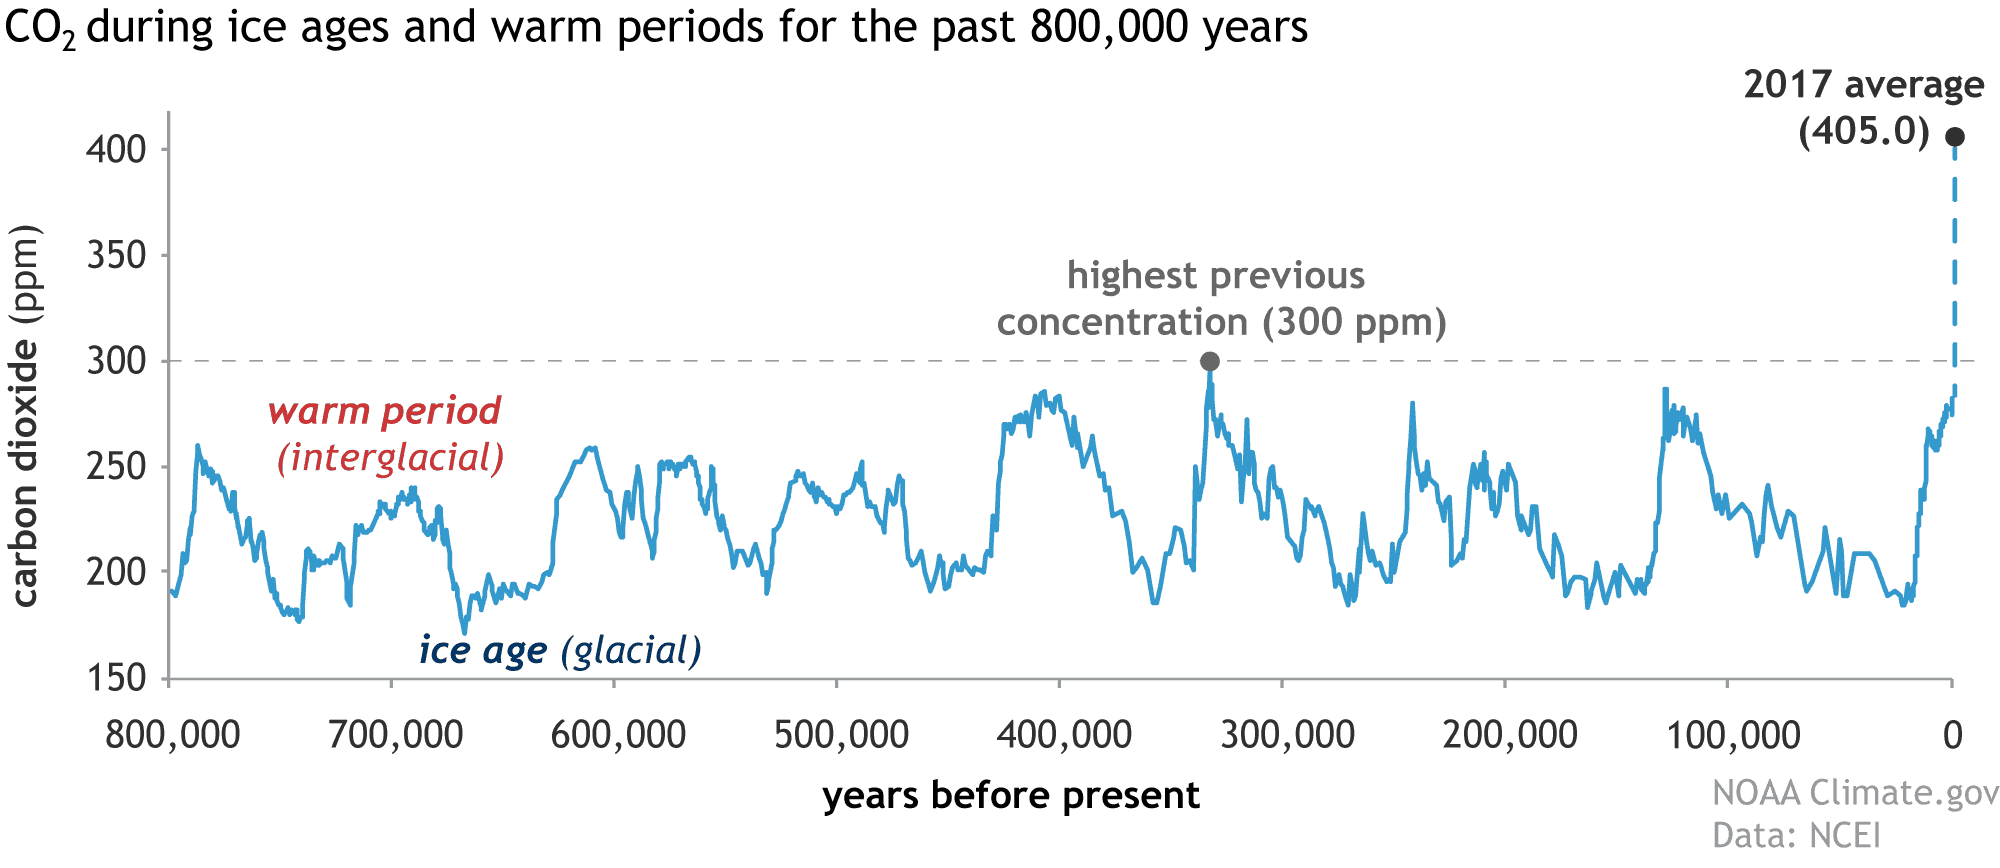
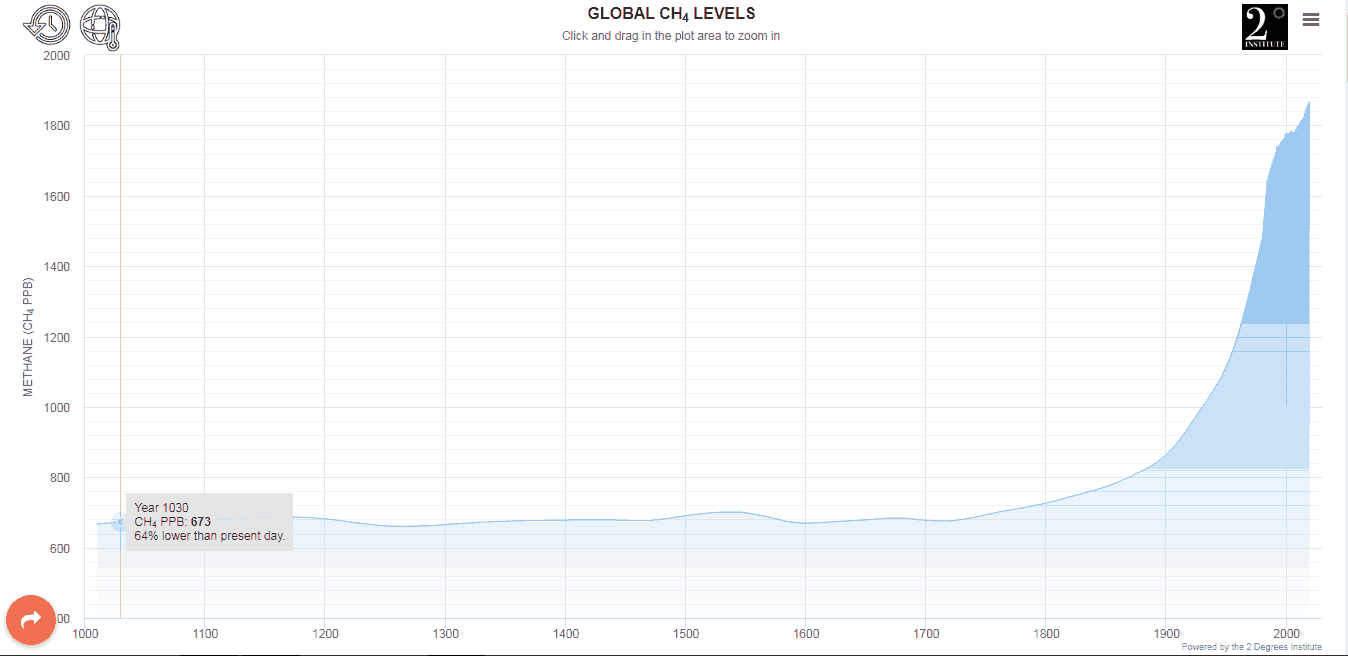
During the lesson, I handed out the graphs one at a time, one each to a bench of students, in a certain order. With every graph, I got them to analyse what it showed and why. Only after we were satisfied with the analysis of a graph and the conclusion we drew from it that I gave them the next graph in the sequence. Towards the end of our lesson, when we were analyzing the last graph, we related our discussions, analysis, and conclusions to climate change. We –as a class, with me working as a guide — extrapolated from the graphs what which I wanted them to learn about climate change.
Can you guess the order in which we analyzed the graphs? (Yes, the order is important.) What conclusions do you think we drew from each graph? And finally, how do you think these graphs are related to climate change? In other words, how do you think I got the students to relate what the graphs charted to climate change?
Finally, as fuel for their constantly thinking and curious minds, I left them with something extra, a challenging question for them to consider and possibly investigate on their own to find the answer to (about something in the charts). What do you think the question was?

