COMMITTED is expanding!
Following the recent approval for a project on local governance, we advertised for a total of 14 new positions, both full- and part-time. We received over 400 applications.
Here are charts showing the particulars of the applications and some charts about the population for comparison purposes.
Incidentally, “applications” instead of “applicants” because a number of applicants submitted applications for two or more positions.
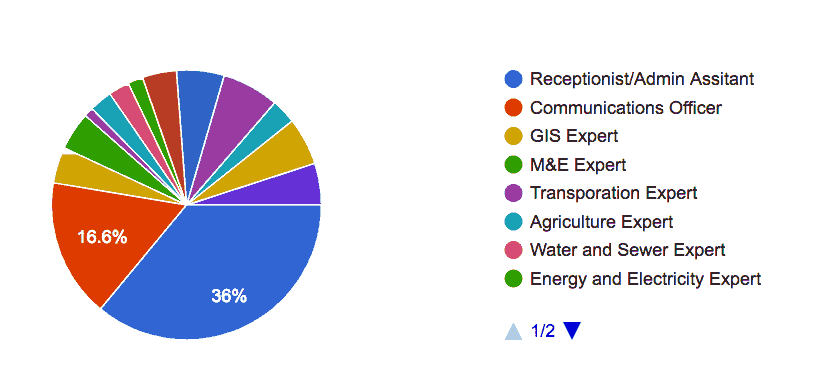
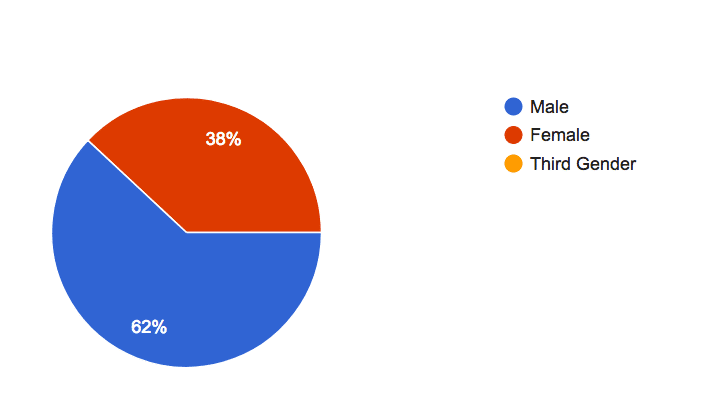
What’s more, almost 2/3rds of all female applications were for the junior-most position of Receptionist/Admin Assistant. 80% of all women applications accounted for the two junior-level positions of Receptionist/Admin Assistant and Communications Officer.
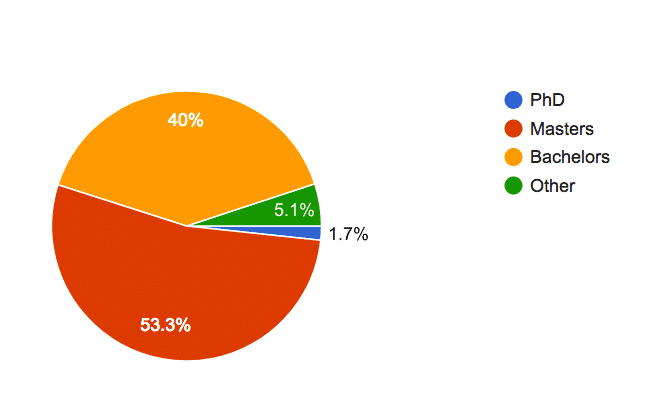
Of those with a masters (53.3%), a vast majority of them (73%) are men! Only 14% of all female applications had a Master’s degree.
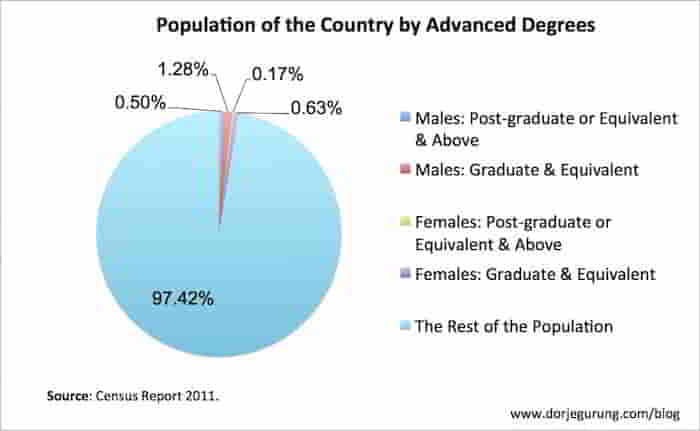
Here’s a breakdown of the population of the country by advanced degrees and gender.
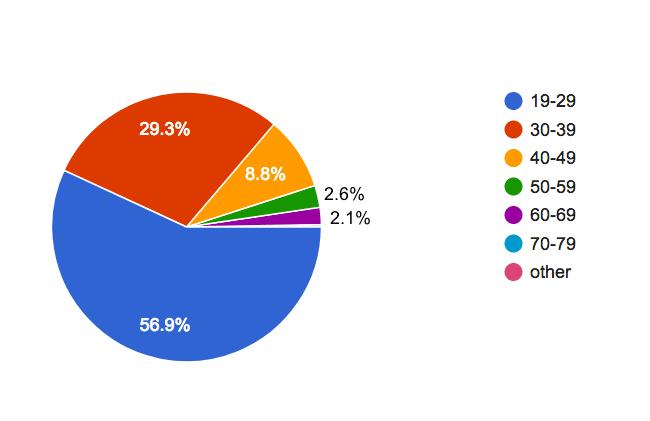
No woman applicant, whose age could be determined, was older than 39! What’s more, 75% of them were between the ages of 19-29!
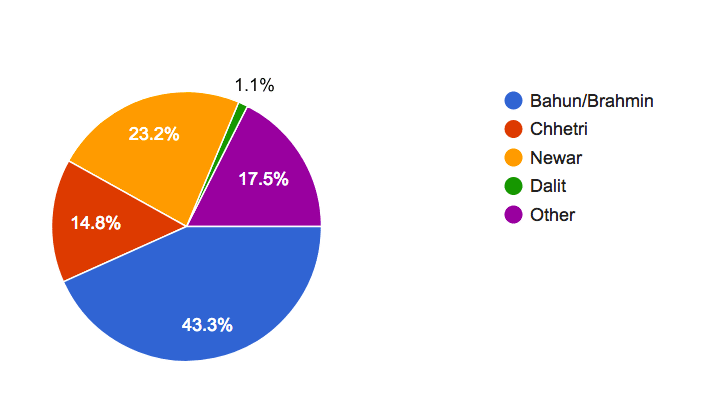
Of the seven with PhDs, four are Bahun (Brahmin), one Newar and two Other.
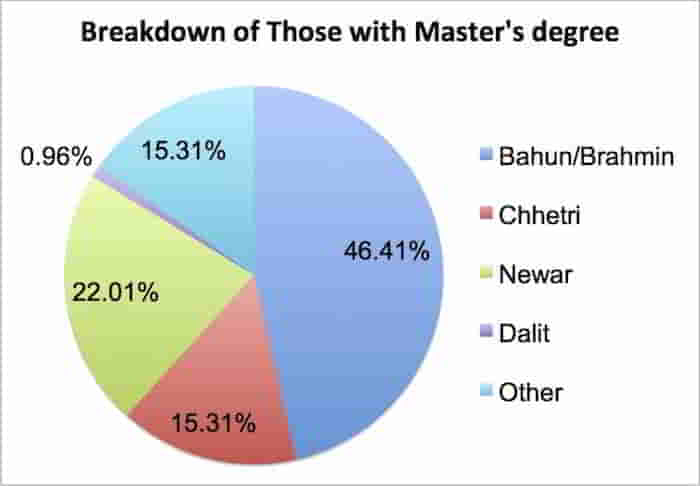
Here’s a breakdown, by caste, of the (209) applications with a Master’s degree.
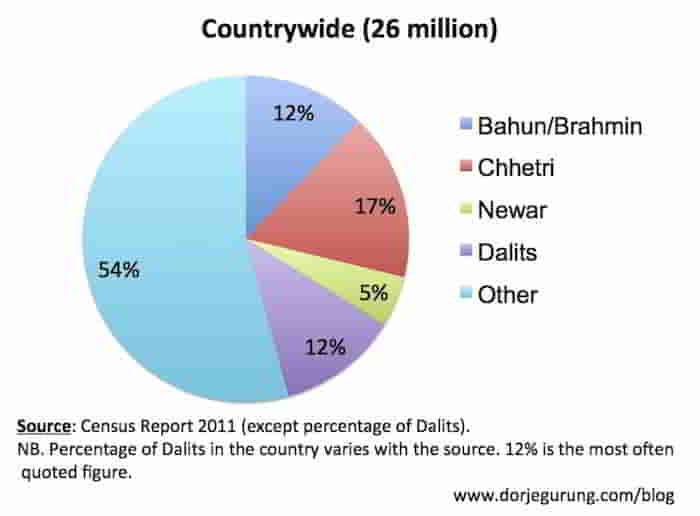
Here’s a breakdown of the population of the country by caste.
What do you think?
* * * * * * * *
References
These were added after the publication of the post because of their relevance. They are updated continuously.
The Kathmandu Post (Oct. 16, 2018). Brahmins and Chhetris land most government jobs. “Brahmins and Chhetris, two dominant classes in Nepali society, continue to lead in terms of landing civil service jobs despite an inclusive hiring policy reserving quotas for Janajatis, Dalits and other disadvantaged groups.” [Added on Oct. 19, 2018.]

